I saw this visualisation floating around my twitter and trending on Tableau Public and thought it would make a great challenge for Workout Wednesday. Big thanks to Jacob for letting me use his visualisation as inspiration today!
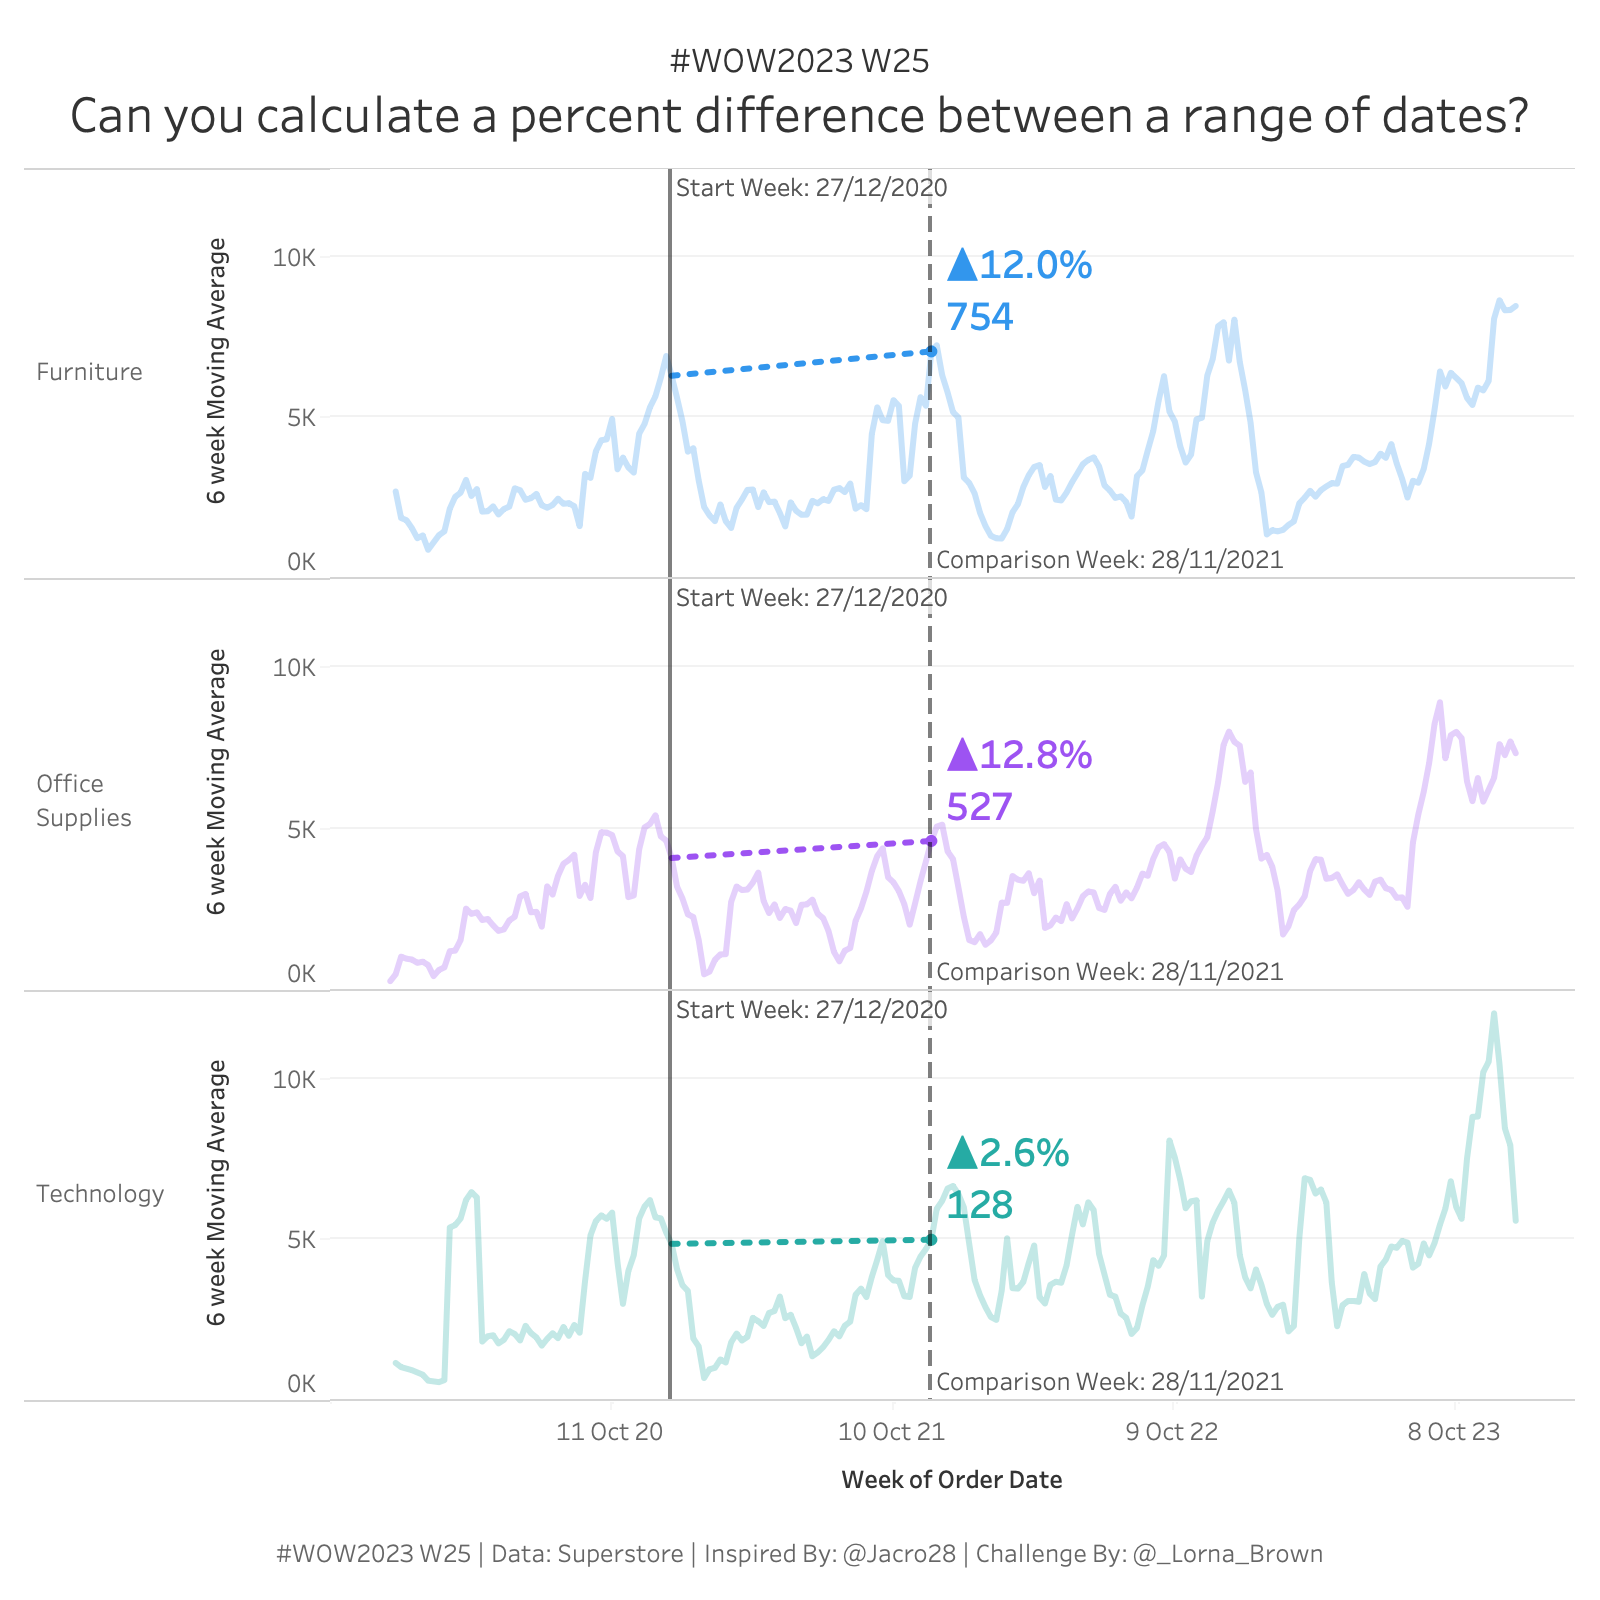
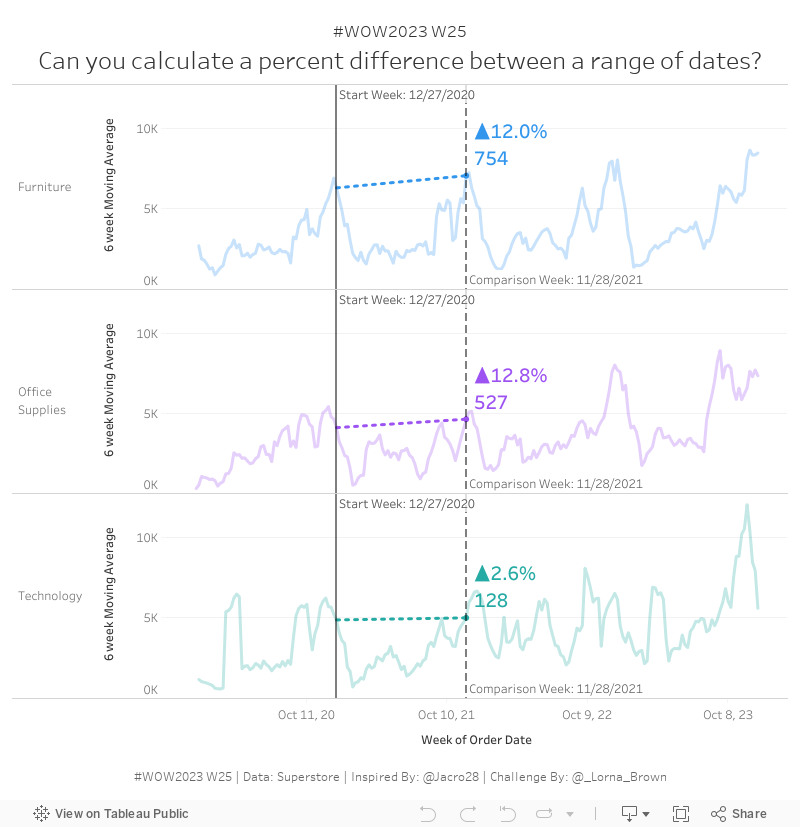
In this weeks workout, I want you to look at the percent change between two dates, we will also be using the new feature of dashed lines in 2023.2.
I did this with Table Calculations, but you might be able to do it with LODs
Create a line chart showing the 6 week moving average for sales
Create two reference dates, one you click to select the starting date and the other is hover for the comparison date
Create the difference and percentage change between those two dates and plot as a dashed or dotted line (for this you will need version 2023.2, if not available a non-dashed line will work)
Match formatting but colours are optional
Dataset
This week uses the standard Superstore data set. You can find it here on Data.World
Attribute
When you publish your solution on Tableau Public make sure to take the time and include a link to the original inspiration. Also include the hashtag #WOW2023 in your description to make it searchable!