Introduction
This week we are tackling Antarctic ice data. The changing sea ice will represent significant challenges for ourselves but even more for future generations. One thing we’ve come to realize in the past few years is that changes are coming much faster than we ever anticipated.
For this week’s challenge we’re going to use data antarctic ice extent data from National Snow and Ice Data Center. The data is in Millions of Square Meters [MSM]. In case you need a comparison: 1,000,000 square meters is about the same as 386,102 square miles–or roughly California, Montana, and Washington combined.
I must mention, the challenge is heavily inspired by the work of Zack Labe. Who shares many charts on the topic of change in our oceans and climate.
Sea ice continues to grow slower than average in the #Antarctic (austral winter), which has led to an even larger extent anomaly in the last few days. An obvious record low for this time of year. Yikes.
— Zack Labe (@ZLabe) June 25, 2023
See more graphics at: https://t.co/V0Lt0w1sTi. Data from @NSIDC. pic.twitter.com/WDSyBOM7jm
For this challenge you need you need to be able to calculate 7-day rolling averages and compare them to 7-day rolling averages of the daily historical averages.
Requirements
- Dashboard Size: 600 x 600px
- 1 sheet
- 1 legend
- 1 text box
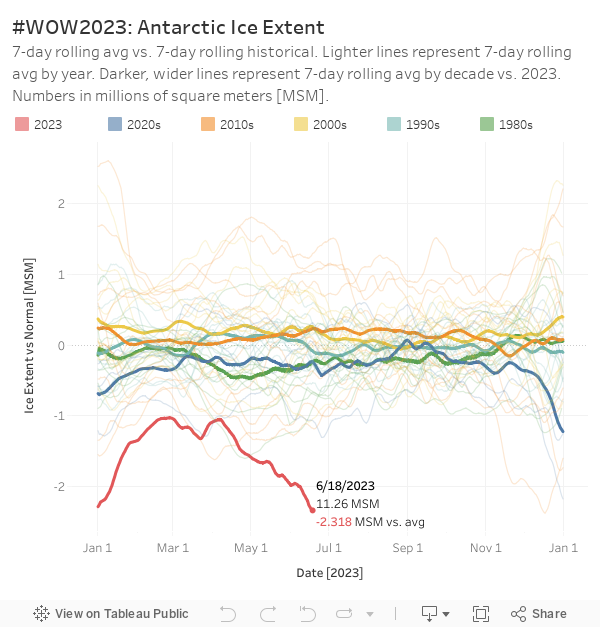
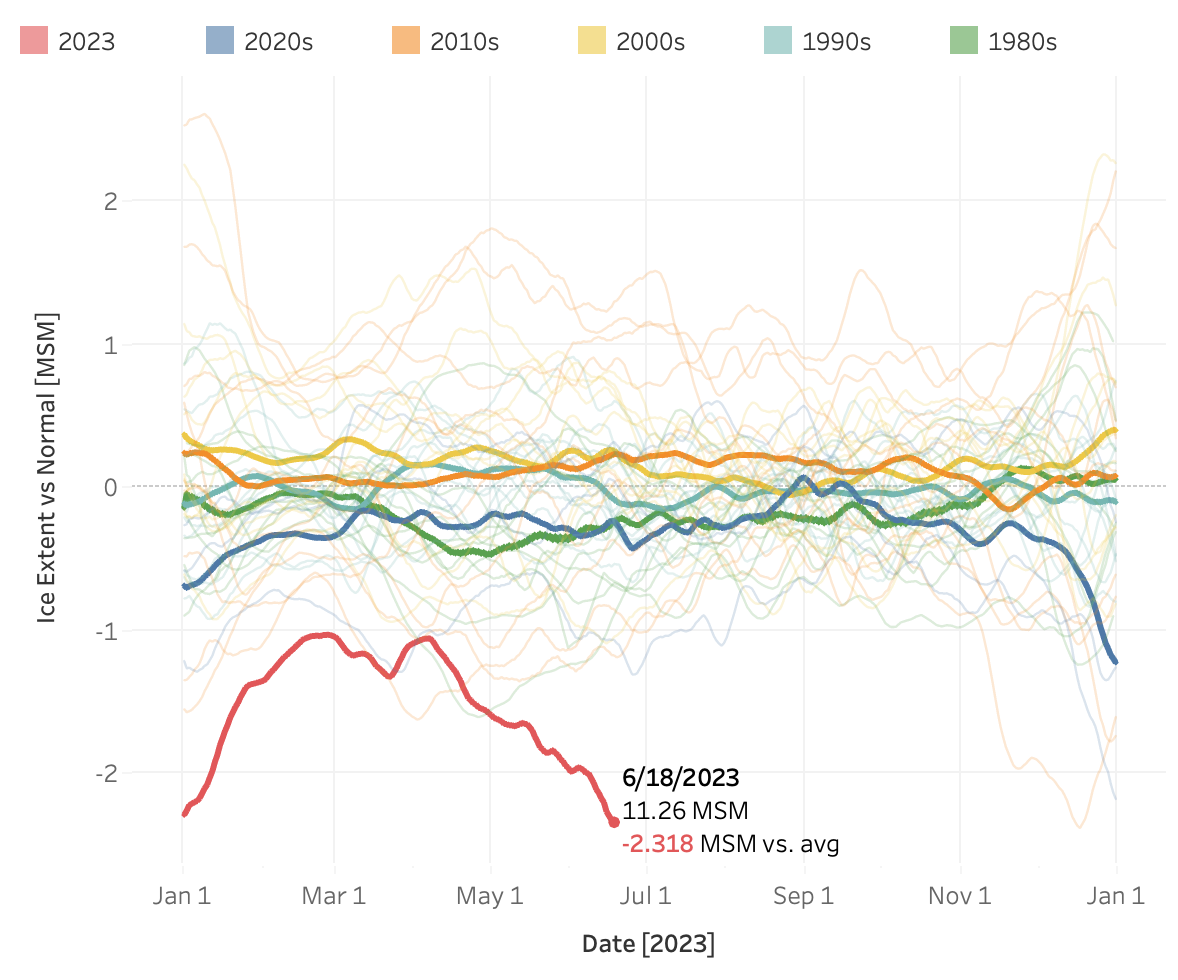
- Create a line chart. On the x-axis will be the month and day of the week for every year. On the y-axis will be the Ice Extent vs Normal
- The Ice Extent vs Normal is calculated by estimating the 7-day rolling average of temperatures (including the selected date), and comparing that to the 7-day rolling “global” average of that particular day and month of the year (you can use table calculations or level-of-detail calculations). An example of the “global” average is the average temperature for all years on June 18th. After calculating the “global” average you can then calculate the 7-day rolling average.
- Place darker, thicker lines on the chart that are color coded by 2023 and for all other years by decade.
- On the same chart using 30% opacity, and as thin of lines as possible, show the values by year.
- Show the labels on the last value.
- Match the formatting
- Match the tooltips
Dataset
The dataset this week uses date from the National Snow and Ice Data Center.
You can get the data via their FTP.
Or use the Google Sheet I have with the data (some of you may need to export it to csv).
Attribute
When you publish your solution on Tableau Public make sure to take the time and include a link to the original inspiration. Also include the hashtag #WOW2023 in your description to make it searchable!

Share
After you finish your workout, share on Twitter and/or LinkedIn using the hashtag #WOW2023 #Tableau and tag @WorkoutWednsday
Solution
Interactive