We’re continuing retro month this week, and I decided to re-viz Andy’s Week 41 challenge from 2017. I chose this one because I really like the concept of being able to drill down from state into city on the same chart, but I wondered if things would be easier than the calculations required to complete the challenge 6 years ago , and it seems like that’s the case!
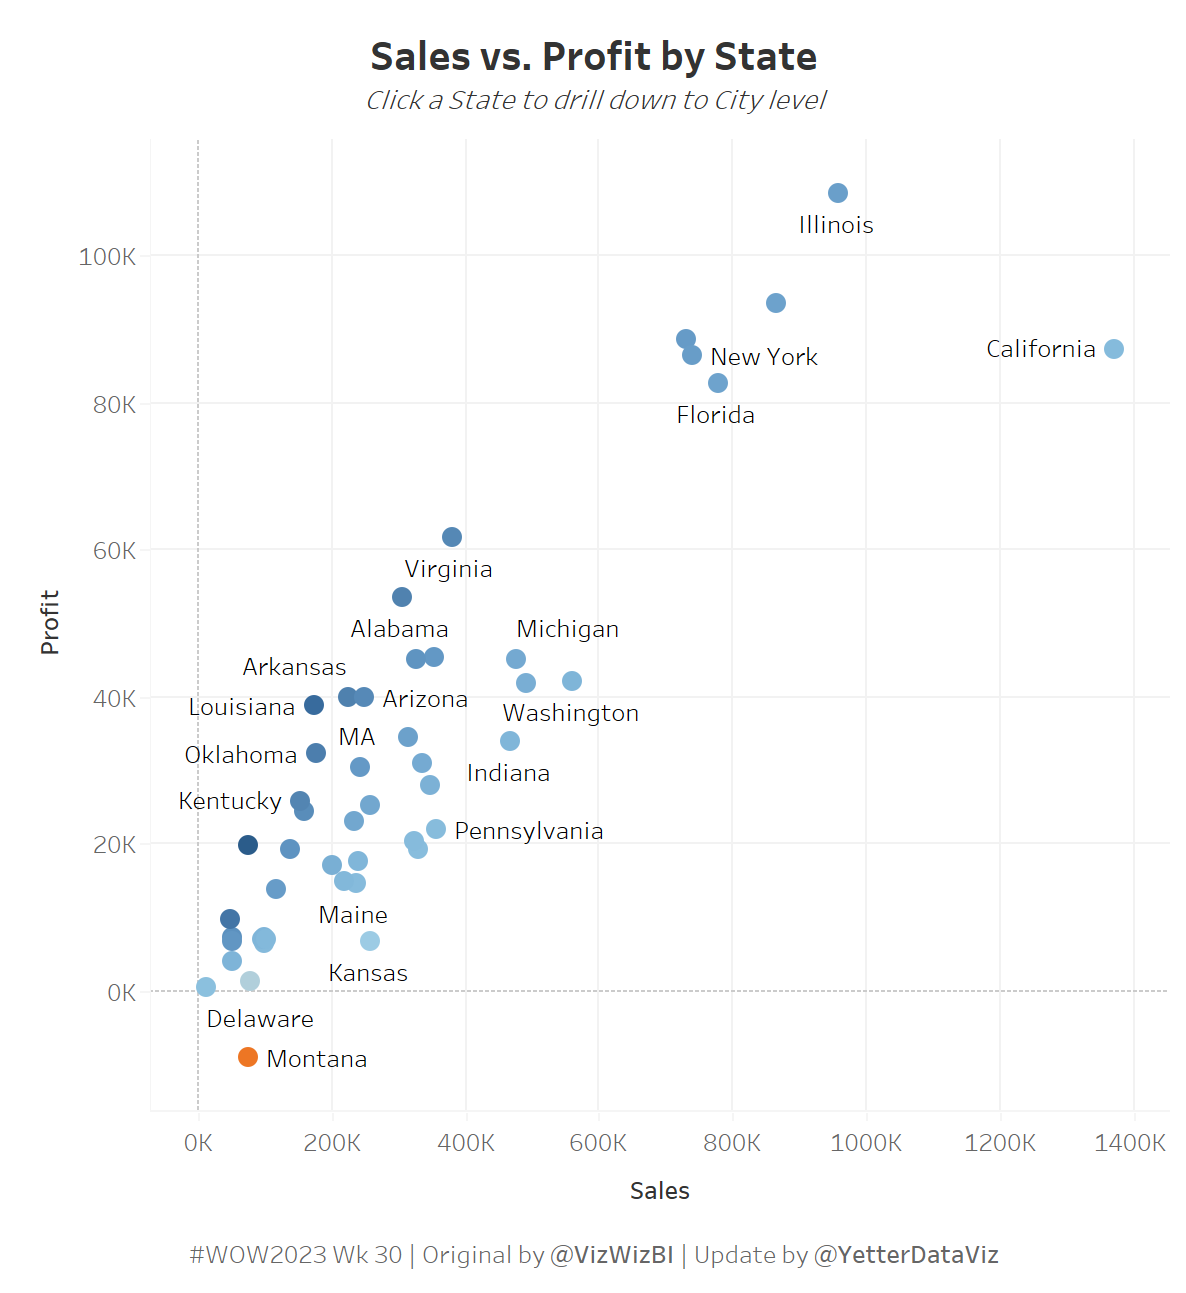
Initially, there should be a dot for each state, colored by profit ratio
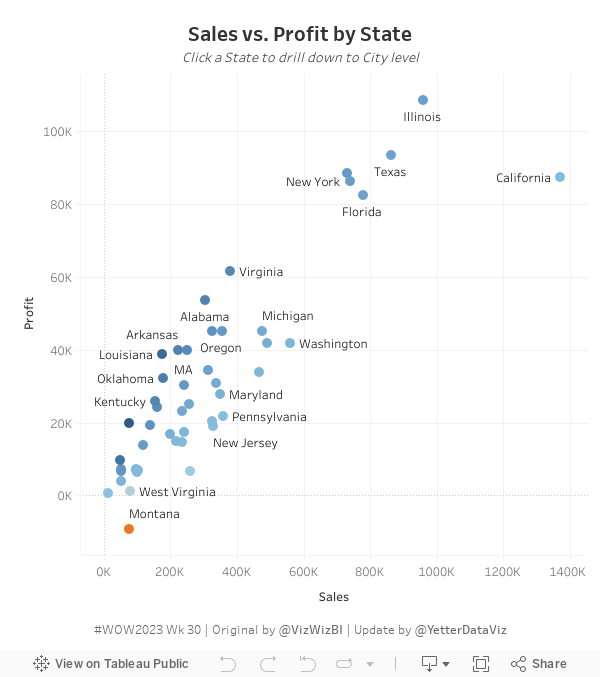
When you click on a state, the view should update to show a circle for each city in that state
When you click on a city, it should drill back up to the state view.
Match the tooltips (they should show state or city, depending on the selection)
Title/Subtitle should update based on whether the view shows states or cities
Dataset
This week uses an adapted Superstore data set. You can find it here.
Attribute
When you publish your solution on Tableau Public make sure to take the time and include a link to the original inspiration. Also include the hashtag #WOW2023 in your description to make it searchable!