When we as coaches discussed Alternative chart types as a theme, I was a little skeptical, however I then remembered I did something different for my Iron Viz, which was creating a Jittered Bar Chart, to show the user ratings.
This week we are going to create something similar but back with the Survey data from Week 4.
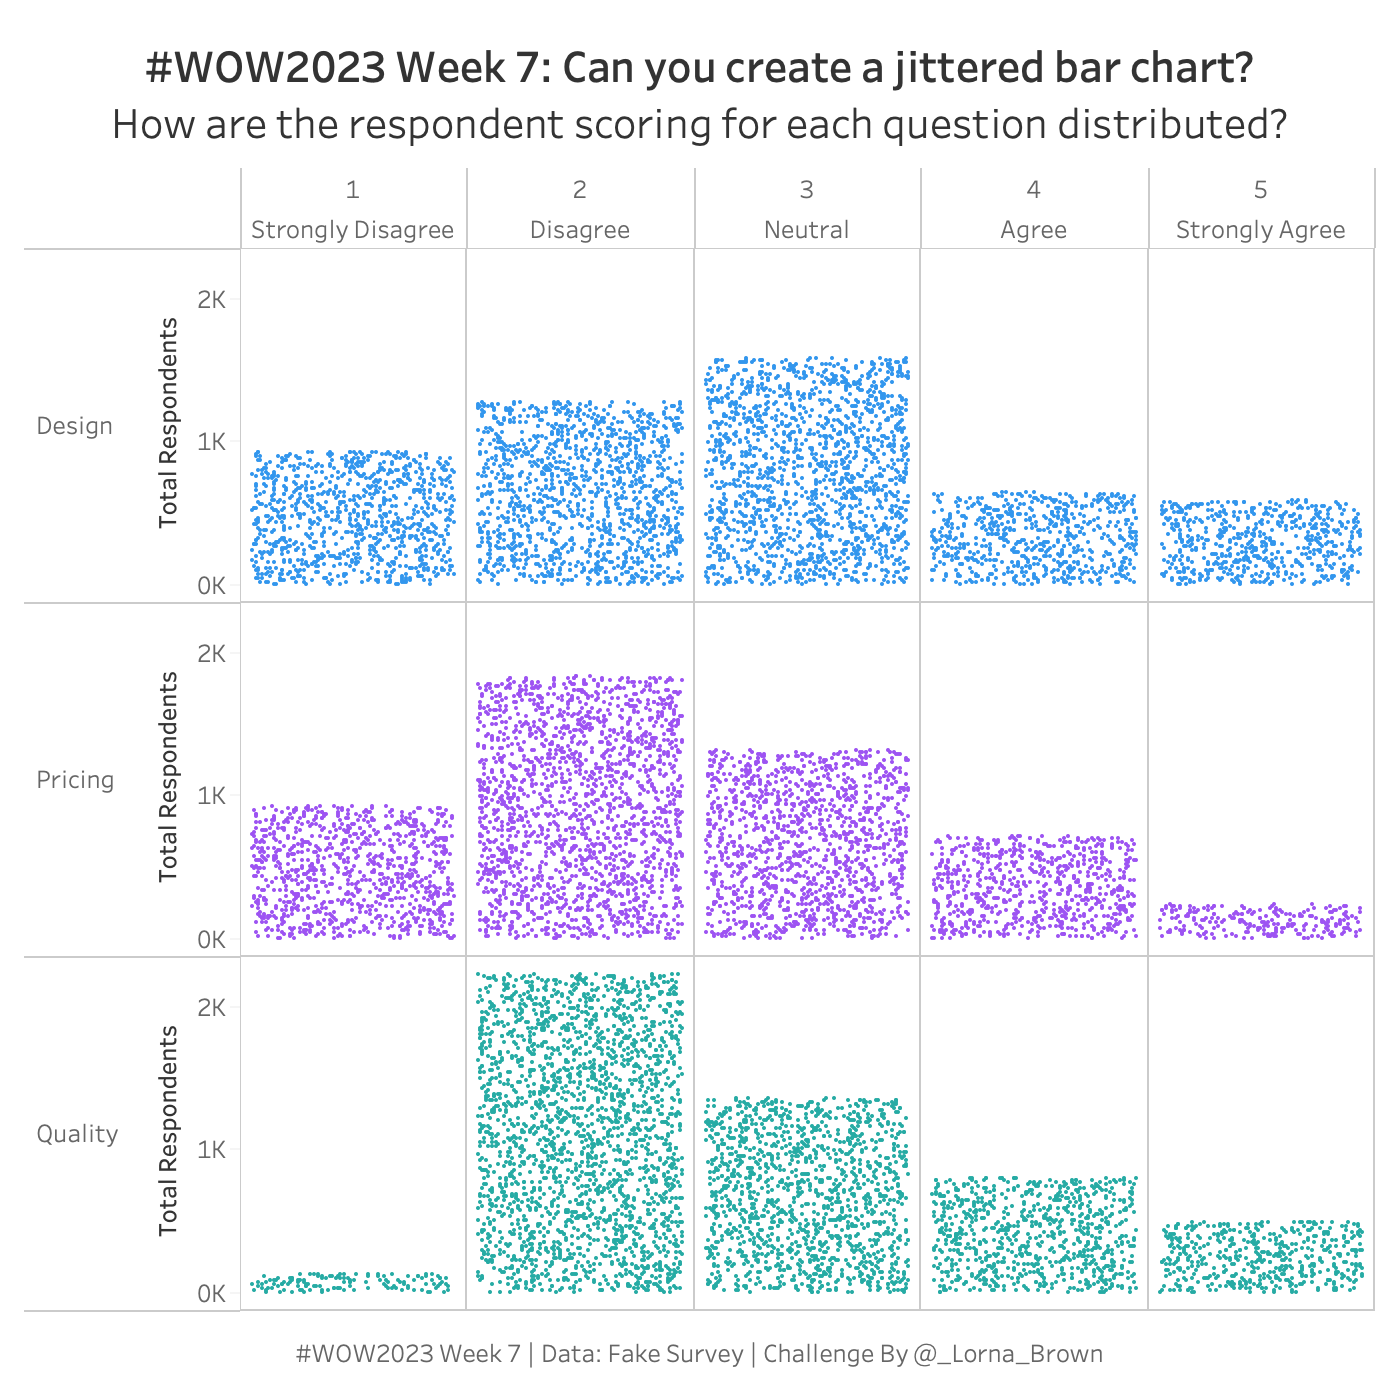
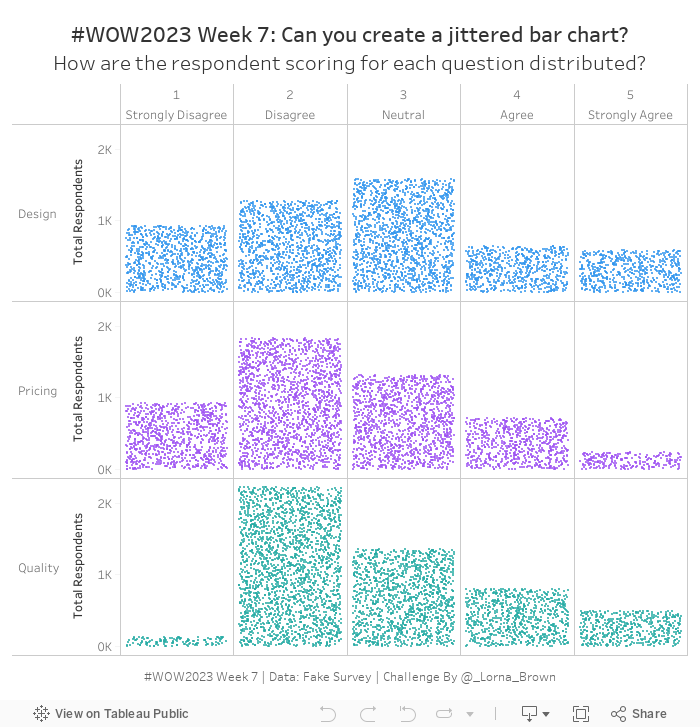
Create a jittered bar chart showing the number of respondents per question, per category per answer
Dataset
This week uses a fake survey. You can find it here on Github
Attribute
When you publish your solution on Tableau Public make sure to take the time and include a link to the original inspiration. Also include the hashtag #WOW2023 in your description to make it searchable!