Introduction
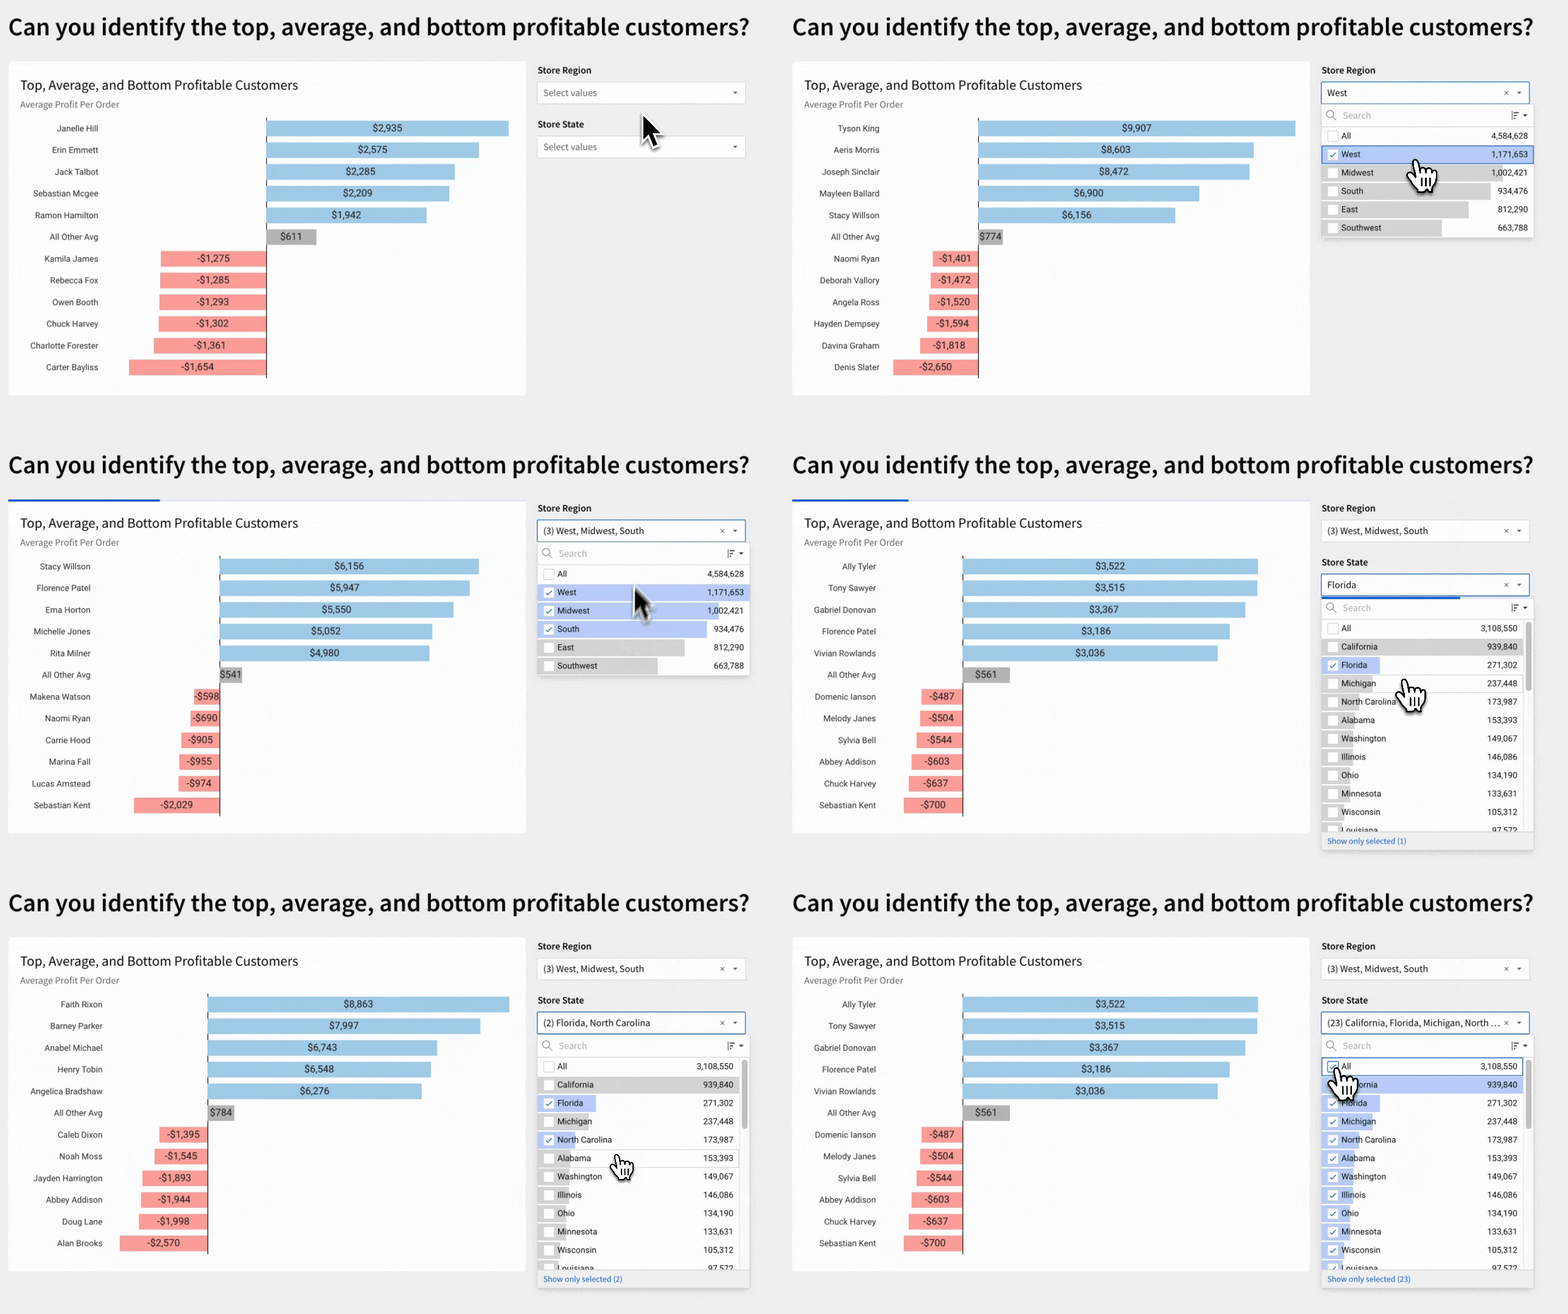
This week, we’re building a staple in my bar chart library: Top, Bottom, and Other Values. I often use this bar chart to easily show the breadth of the outliers while not losing sight of the typical. This challenge is also a great example of the flexibility of modeling at different levels of granularity within tables and visual elements!
Have fun!
-Katrina
Need access to Sigma?
Note: You will only have view access to WOW Workbooks, Folders, and Workspaces, not edit access. Please create your WOW Workbooks under “My Documents.” We suggest creating a folder to organize all your workbooks.

Requirements
- Add a data table element from the Plugs Electronic
- Sigma Sample Database > Retail > Plugs Electronic > PLUGS_ELECTRONICS_HANDS_ON_LAB_DATA
- Create a calculation for the Average Profit Per Order for each Customer Name
- Note: You can use the Profit Metric or a Profit Calculation of Sum(([PRICE] – [COST]) * [QUANTITY])
- Create a Bar Chart that shows:
- Who are the top five and bottom five customers, and what is their Average Profit Per Order
- And the Average Profit Per Order for all other customers not in the top or bottom five
- Apply a Store Region and Store State filter
- Note: The customers and values change when filters are applied
- Formatting:
- Match the Title and Sub-title
- Color the Top, Other, and Bottom Customers
- You can use any colors you’d like
- I used Top: A0CBE8, Other: B4B4B4, Bottom: FF9D99
- Remove tick marks and grid lines
- Remove X-Axis label
- Label all of the middle of the bar with the Average Profit Value in whole dollars
- Bar Gaps: Medium
- Remove Legend
- Optional: Make the number of customers variable
- Hide the Data Tab
- Match the visible tab with elements and title
Dataset
Sigma Sample Database > Retail > Plugs Electronic > PLUGS_ELECTRONICS_HANDS_ON_LAB_DATA
Share
After you finish your workout, share on LinkedIn, Sigma’s Community page, (or Twitter) using the hashtags #WOW2024 and #SigmaComputing, and tag Ashley Bennett, Eric Heidbreder, and Katrina Menne!
Create an interactive, sharable version of your solution here.
Also, make sure to fill out the Submission Tracker so that we can count you as a participant this week to track our participation throughout the year.
