Introduction
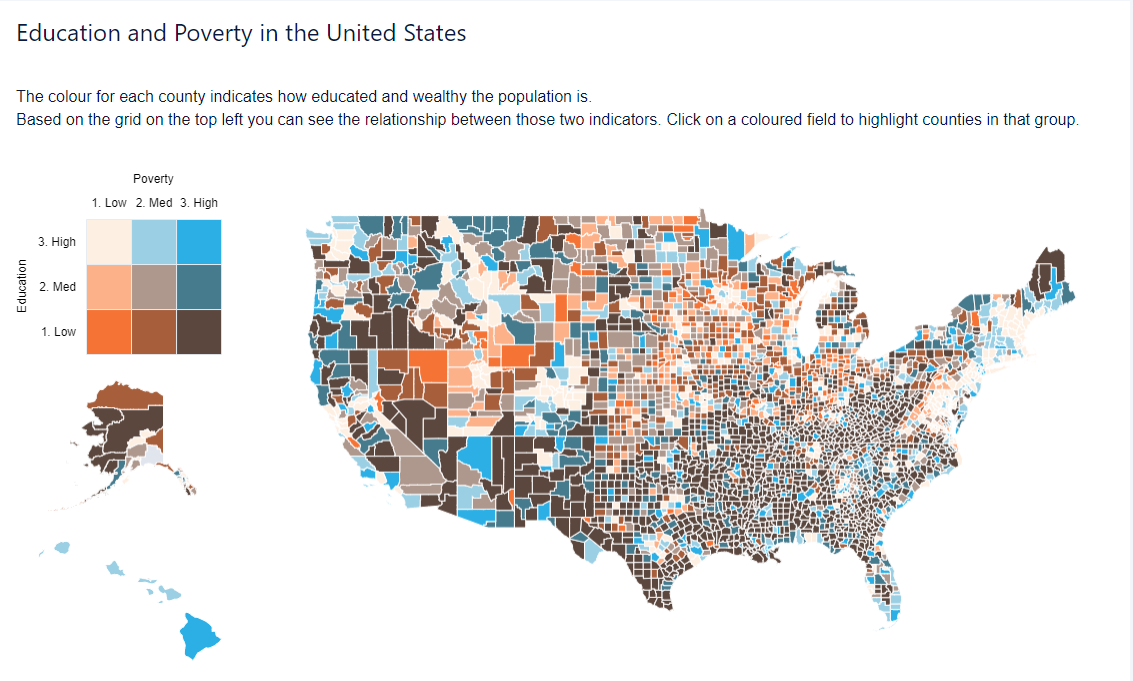
Here is a fun one to keep the map theme going: Bivariant maps!
These maps are a good way to encode two variables on a map and give the user a way to see the relationship between the two at a glance. But beware, correlation does not imply causation. So, while for this map we can clearly see a correlation between education and poverty, we cannot – with certainty – say whether poor education means you earn less money or whether less money doesn’t enable you to get a good education!
I recently stumbled upon this blogpost by Will Heikes and thought it would be a great one to try myself.
I tried to make it work with compare tables like Will did, however I think I had too many contradicting requirements to make it work. If you enjoy torturing yourself, feel free to make it all work within a CRMA dashboard. If you value your sanity, I recommend leveraging recipes do get the right fields!
Requirements
- Create the dashboard below
- Match the heading
- Include a map of the continental US as well as Hawaii and Alaska
- Colour each county based on the poverty and education level within the county
- Thresholds:
- Poverty: <10%, 10%-13.5%, >=13.5%
- Education: <27.72%, 27.72%-28%, >28%
- The buckets cover about 50%,25% and 25% of all counties
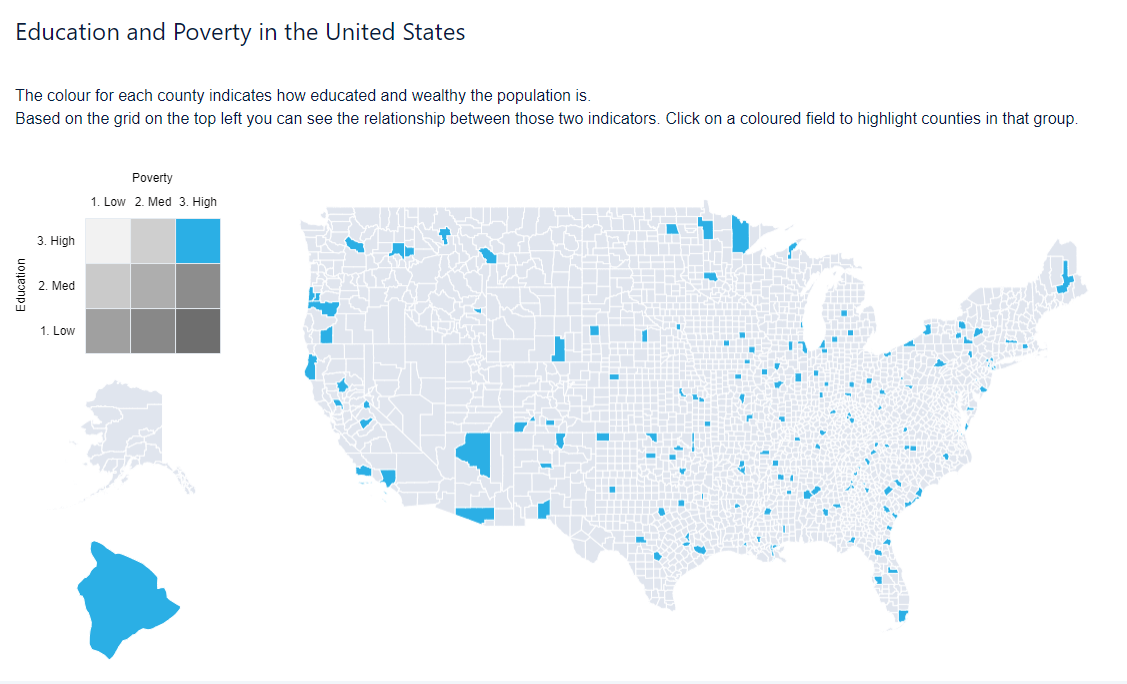
- Create a dynamic legend that explains the colours and lets you highlight certain buckets
- Use the following colours:
- rgb(254, 239, 227), rgb(155, 207, 228), rgb(43, 175, 229)
- rgb(252, 177, 137), rgb(174, 151, 140), rgb(70, 122, 141)
- rgb(245, 115, 52), rgb(167, 94, 59), rgb(91, 71, 62)
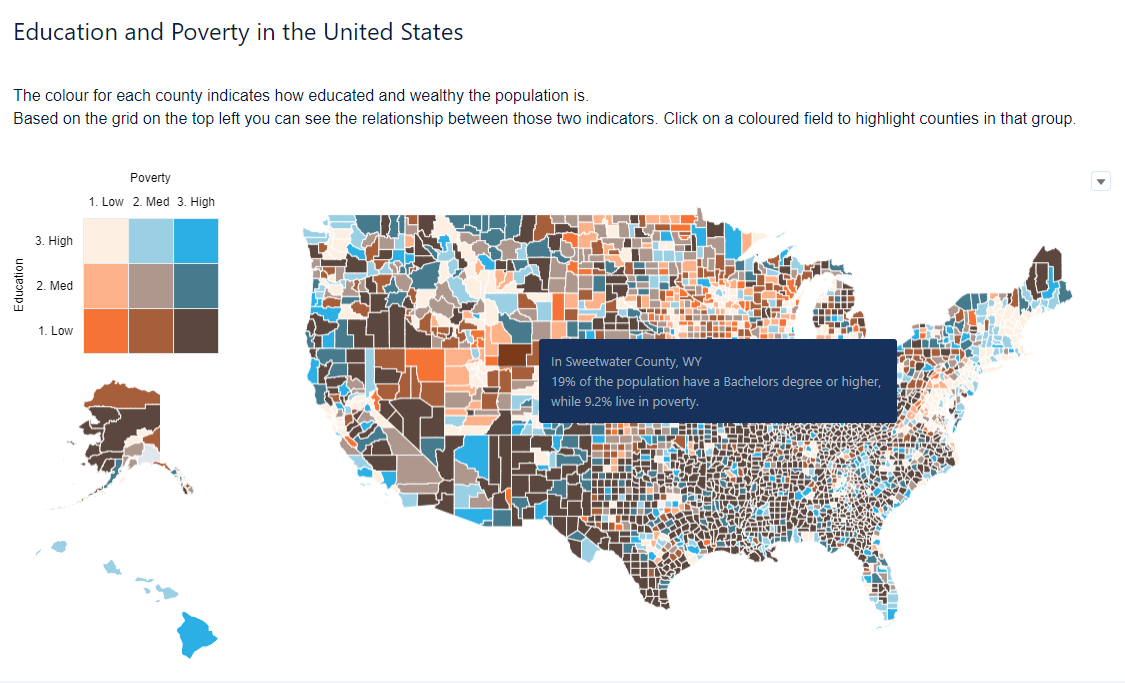
- Match the tooltips
The resulting dataset should look something like this: