Introduction
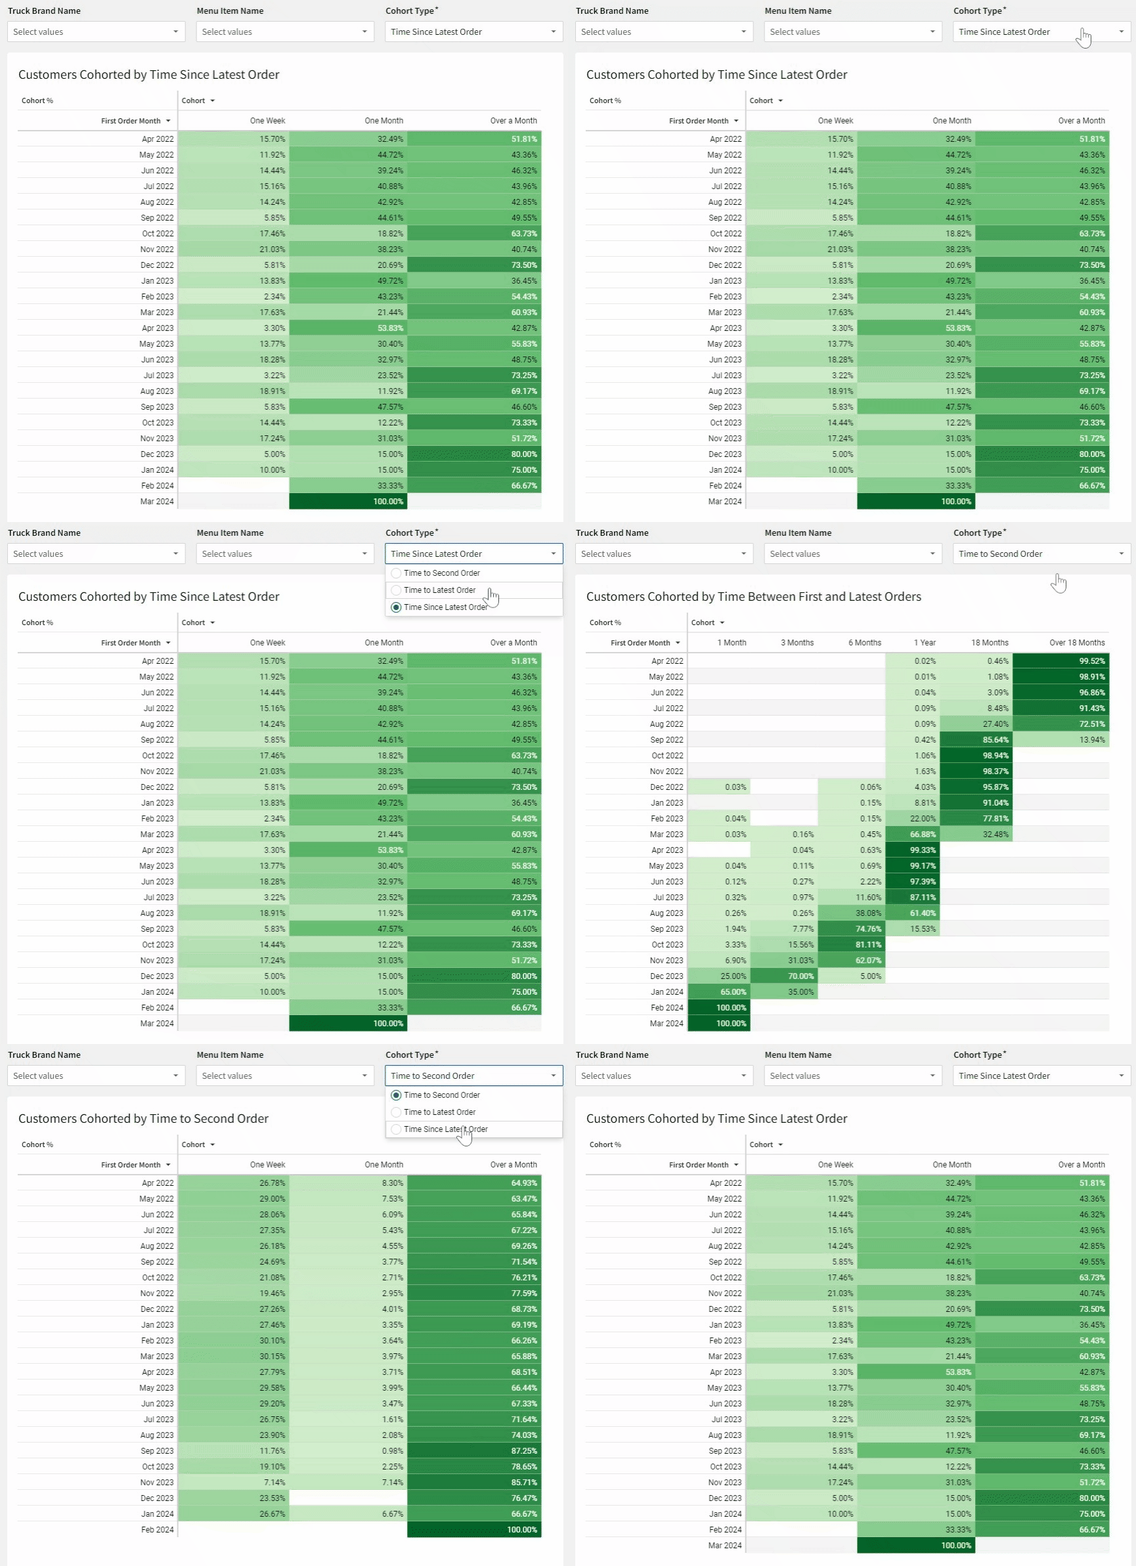
Welcome to Week Seventeen! This week, you’re going to perform a Cohort Analysis of food truck customers based on when they placed their first order. Conditional formatting will help highlight which cohorts have a greater percentage of customers in them.
As a bonus, you will implement a dynamic page control input to let the user choose how to cohort their customers.
Good Luck!
-Ashley
Need access to Sigma?
Note: You will only have view access to WOW Workbooks, Folders, and Workspaces, not edit access. Please create your WOW Workbooks under “My Documents.” We suggest creating a folder to organize all your workbooks.
Requirements
- On a hidden Data Tab:
- Add data from the Tasty Bytes Food Trucks Schema: Simple Sample Database / Retail / Tasty_Bytes_Food_Trucks / FCT_ORDERS
- Group this data table by Customer ID
- Find the First, Second, and Latest Order Dates
- Find the time between these dates for each Customer ID:
- Days Between First and Second Orders
- Months Between First and Latest Orders
- Days Since Latest Order, relative to Today
- Create a Child Table from this original grouped table, collapsed so only the Customer ID grouping level columns flow down to the child table
- Use BinRange to Create 3 Cohort Columns, and then give them user-friendly labels in another column (6 new columns total):
- Hint: There are multiple ways to apply user-friendly labels. Choose one that is easiest for you.
- Days to Second Order Cohort: One Week, One Month, and Over a Month. To simplify this, we will consider 30 days to be One Month.
- Months to Latest Order Cohort: 1 Month, 3 Months, 6 Months, 1 Year, 18 Months, and Over 18 Months
- Days Since Latest Order Cohort: One Week, One Month, and Over a Month. To simplify this, we will consider 30 days to be One Month.
- Create a manual List Control that allows you select one of the 3 cohorts.
- All only one, Required input
- Create 2 new columns in your Cohort table that output the selected Cohort Bin Number and Name.
- Group the table by First Order Month
- Find the Total Monthly Customers, which is a Row Count at the First Order Month Grouping Level
- Add a 2nd, lower Grouping that Groups by the Dynamic Named Cohort and Bin Number
- Find the Number of Customers (Row Count) at this Grouping Level
- Add a filter on this table that excludes any null Dynamic Cohort values
- Use BinRange to Create 3 Cohort Columns, and then give them user-friendly labels in another column (6 new columns total):
- Add data from the Tasty Bytes Food Trucks Schema: Simple Sample Database / Retail / Tasty_Bytes_Food_Trucks / FCT_ORDERS
- On a visible page:
- Create a Pivot Table:
- Rows: First Order Month sorted ascending.
- Columns: Dynamic Cohort sorted by Dynamic Bin Number ascending.
- Values: Cohort %. This is defined as the Number of Customers at Cohort Level divided by Total Monthly Customers
- Add a dynamic title, so users know exactly what the Customers are Cohorted by.
- Hide both the column and row Totals
- Move the Cohort Page Control to the visible page for user interaction
- Add Page Control filters for Truck Brand Name and Menu Item Name
- As is best practice, target an element in the workbook that is as far upstream as possible.
- Add an informative title
- Arrange your elements into a simple dashboard
- Other formatting:
- Use a Presentation Table Style, choosing options that you believe look best
- Add Conditional Formatting that gives a background scale to the Cohort %. Use a palette that goes light to dark, so that stronger cohorts stand out more.
- Create a Pivot Table:
Dataset
Simple Sample Database / Retail / Tasty_Bytes_Food_Trucks / FCT_ORDERS
Share
After you finish your workout, share on LinkedIn, Sigma’s Community page, (or Twitter) using the hashtags #WOW2024 and #SigmaComputing, and tag Ashley Bennett, Eric Heidbreder, and Katrina Menne!
Create an interactive, sharable version of your solution here.
Also, make sure to fill out the Submission Tracker so that we can count you as a participant this week to track our participation throughout the year.
Solution
Coming Soon!


