
Introduction
Welcome to Week Seven! This week, you’re going to create a line graph that can change its date granularity. With a dynamic x-axis, this graph allows users to view trends at the level that makes sense for their current needs, without duplicating work.
Also in this challenge, you’re going to learn how to show the same value formatted differently in the Y-Axis and ToolTip. This is handy for minimizing the space your Y-Axis takes while still being able to expose the full value to users.
Good Luck!
-Ashley
Need access to Sigma?
Note: You will only have view access to WOW Workbooks, Folders, and Workspaces, not edit access. Please create your WOW Workbooks under “My Documents.” We suggest creating a folder to organize all your workbooks.
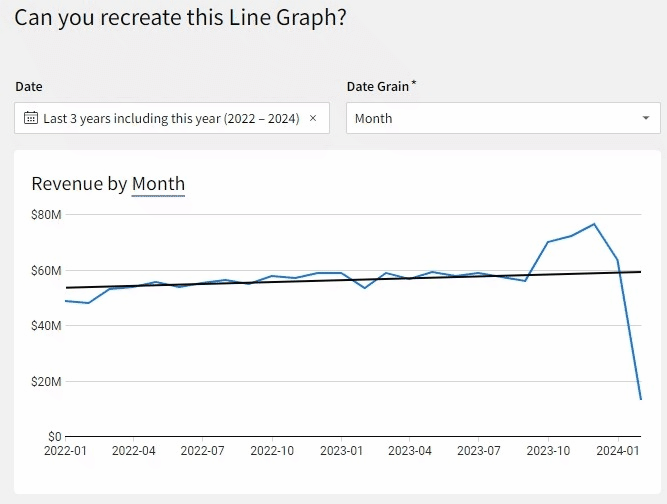
Requirements
- Add a data element from PLUGS_ELECTRONICS_HANDS_ON_LAB_DATA
- Sigma Sample Database > Retail > Plugs_Electronics
- Note that ‘Revenue’ is hiding in the ‘Metrics’ tab.
- Hidden Data Tab
- On a visible page:
- Create a list page control where users can select an appropriate [Date-Grain] (day, week, month, quarter, year)
- This control should be a required, single select control without a null option.
- Hint: The text value should be lowercase, as Sigma would expect in a DateTrunc function
- Create a line graph:
- X-Axis: Create a custom column that truncates the [Date] column at the [Date-Grain] control value.
- Y-Axis: Use the Revenue Metric
- Add a filter on the [Date] column and convert it to a page control for user interaction.
- Add a linear Trend Line
- Formatting Requirements:
- The Y-Axis should be formatted to $ SI Units ($.2~s)
- Utilize a Custom ToolTip to display Revenue as Currency rounded to the nearest dollar.
- The ToolTip should only show the Date at Grain and the full Revenue value.
- Give the graph a friendly name
- Easy Option: Revenue Over Time
- Challenging Option: Use Dynamic Text, so the title displays as Revenue by [Date-Grain].
- The entire title should be in Proper case
- Create a list page control where users can select an appropriate [Date-Grain] (day, week, month, quarter, year)
Dataset
Sigma Sample Database > Retail > Plugs_Electronics > PLUGS_ELECTRONICS_HANDS_ON_LAB_DATA
Share
After you finish your workout, share on LinkedIn, Sigma’s Community page, (or Twitter) using the hashtags #WOW2024 and #SigmaComputing, and tag Adrian Segura, Ashley Bennett, Eric Heidbreder, and Katrina Menne!
Also, make sure to fill out the Submission Tracker so that we can count you as a participant this week to track our participation throughout the year.