Introduction
This week’s challenge is inspired by something I’d seen at work, and I thought it would be quite fun to see if I could reproduce in Tableau and if so, share as a challenge 🙂 I could, so here it is… can you include & exclude options with a custom control?
Requirements
- Dashboard 1000 x 450
- Number of sheets is up to you, but I used 3
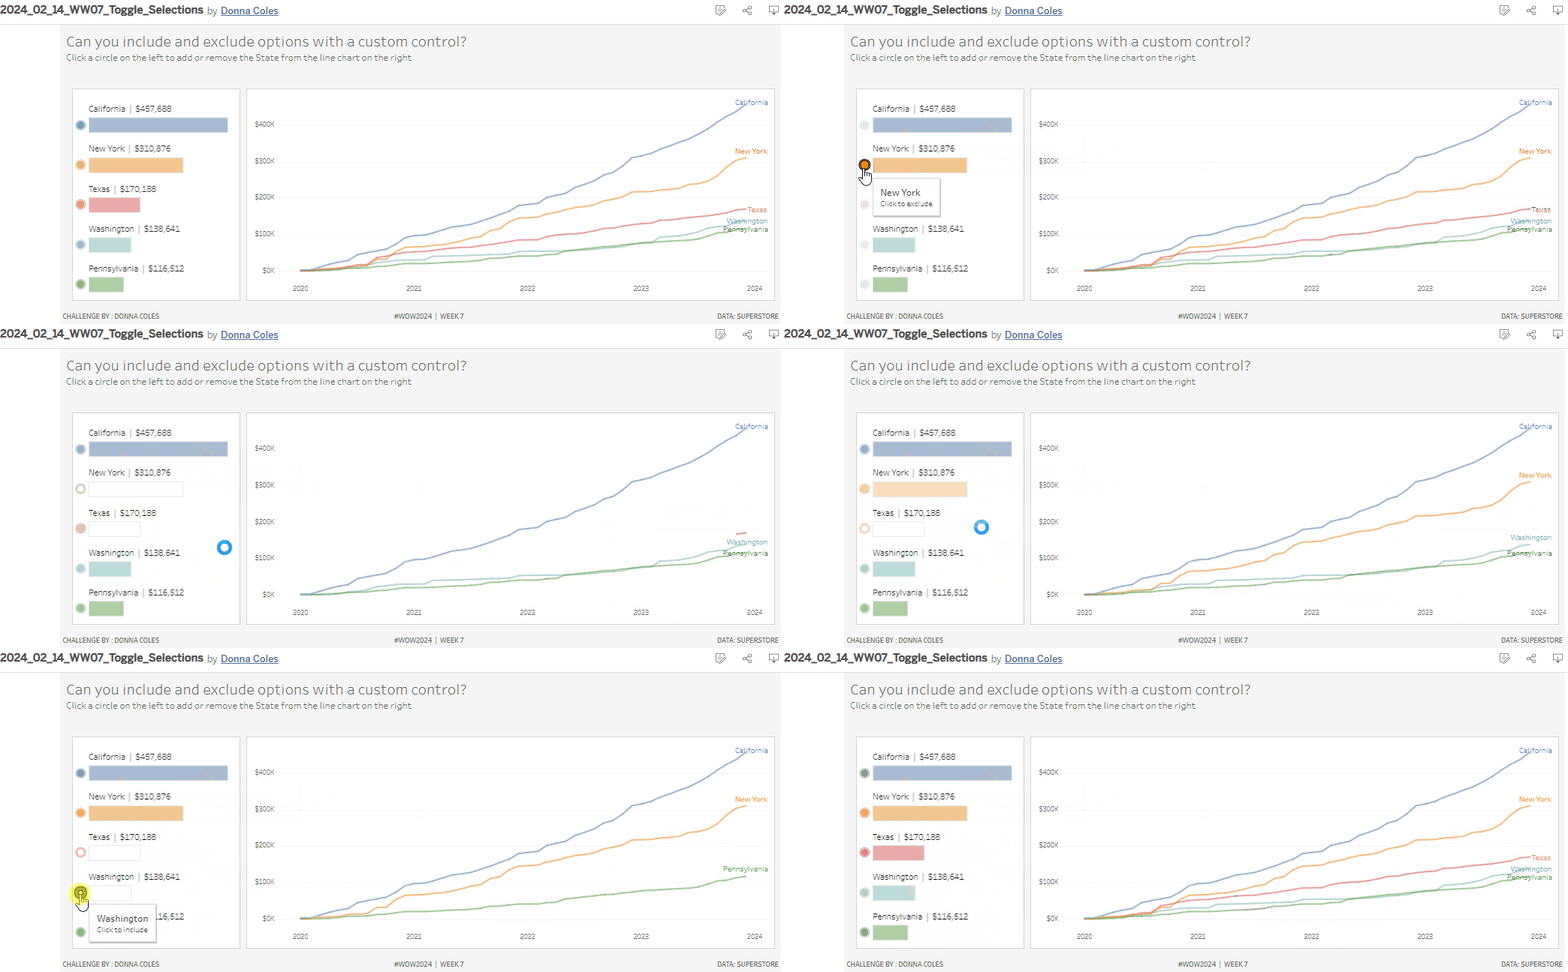
- Only include information related to the top 5 States with the largest overall Sales
- Create a bar chart of Sales by State sorted descending
- Create a line chart of cumulative monthly sales by State
- Provide a custom control ‘button’ that excludes/includes the selected State in the line chart when clicked, and changes the display of the bar associated to the State.
- Match formatting and tooltips
Dataset
This challenge uses 2023 Superstore data, accessible here if required.
Attribute
When you publish your solution on Tableau Public make sure to take the time and include a link to the original inspiration. Also include the hashtag #WOW2024 in your description to make it searchable!

Share
After you finish your workout, share on Twitter and/or LinkedIn using the hashtag #WOW2024 #Tableau and tag @WorkoutWednsday
