I’m always on the lookout for inspiration to share in a #WorkoutWednesday challenge, and Sam Parson’s recent movie viz provided that for this week.
Sam displayed the total revenue for the top 50 movie franchises, directly alongside a stacked bar depicting the revenue for each individual movie in that franchise. There is also a lot more going on, but this particular feature caught my eye and made wonder ‘can I do that?’.
Well I could, and so once again, I’m asking whether you can too?
1 sheet – note, it may be possible to build this with map layers, but I didn’t.
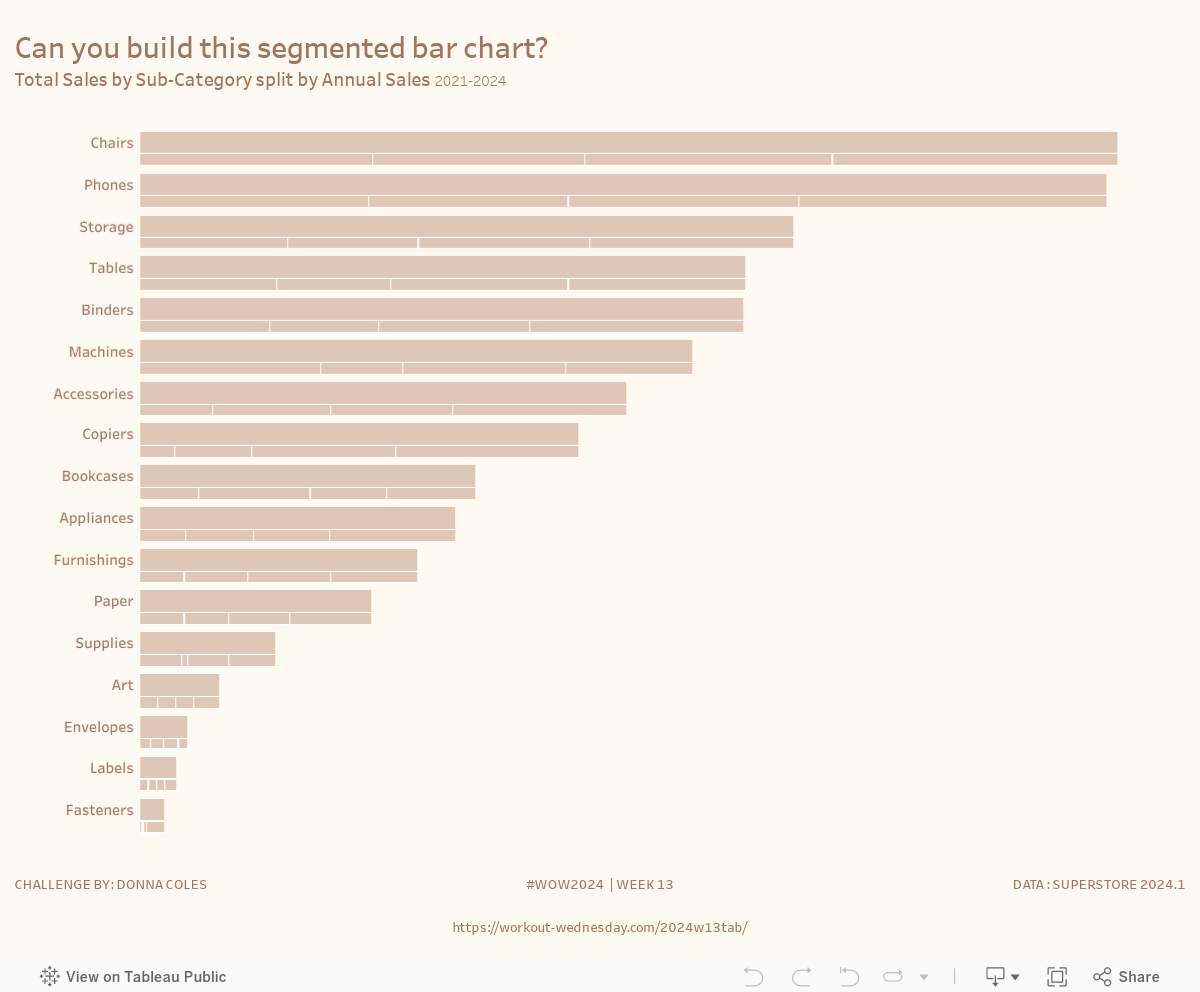
Build a bar chart depicting Sales by Sub-Category, sorted based on the Sub-Category with most sales first.
A single bar should depict the total sales for the Sub-Category
Directly beneath, a stacked bar should be displayed depicting the Sales per Year
Ensure the total bar is wider than the segmented bar.
Ensure there is spacing below each pair of bars
Ensure the label is aligned against the Total bar
Match formatting & tooltips; choose your own colours if you prefer – I used #dec7b6 for the bars and #fefaf1 for the background
PS – there will be a part 2 to this challenge 🙂
Dataset
This challenge uses Superstore 2024.1 which is accessible from here
Attribute
When you publish your solution on Tableau Public make sure to take the time and include a link to the original inspiration. Also include the hashtag #WOW2024 in your description to make it searchable!