One of the perks of my job is that I get to help colleagues solve puzzles that clients throw at them. This is where this came from. Well in fact – the original idea came from a Power BI report, and I wanted to prove it was doable in Tableau.
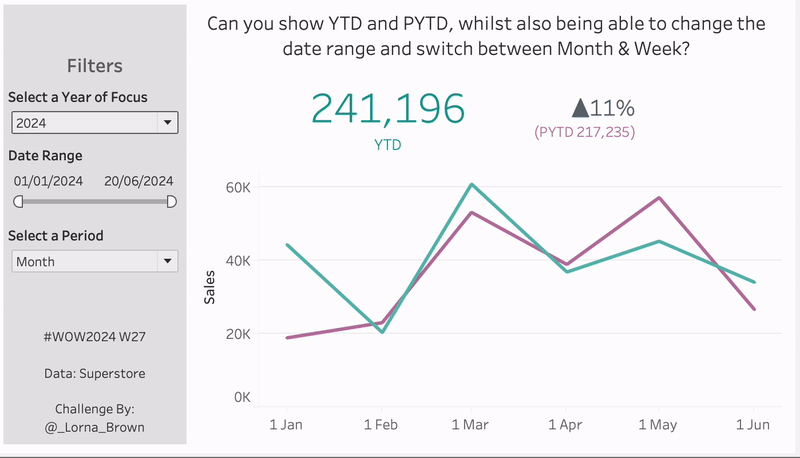
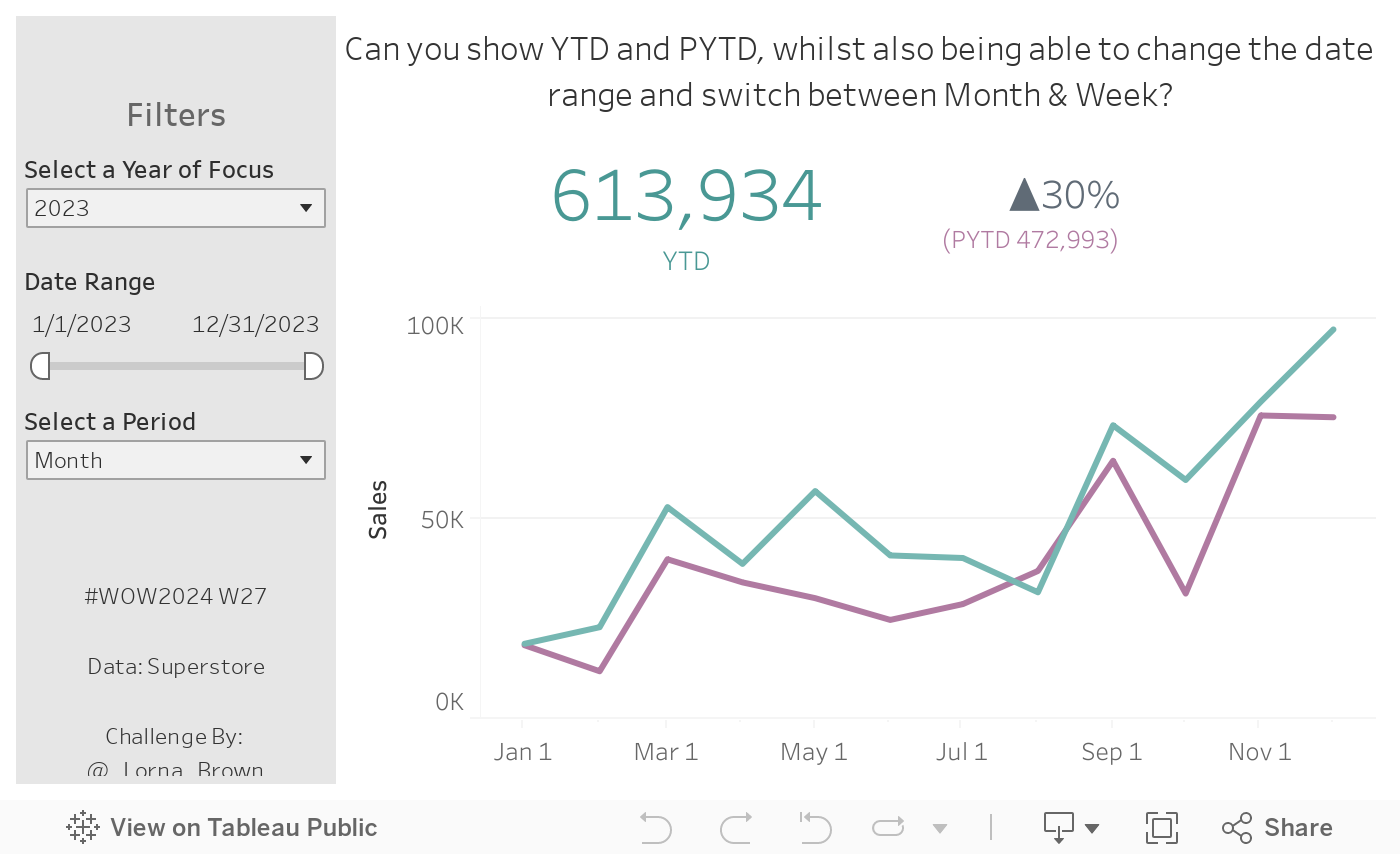
Scenario: The client wants to select which year they are looking at to see YTD, be able to compare that to Prior Year to Date (PYTD), BUT they also want to be able to control a date range, whilst also being able to see that over time either by Month or by Week.
Dashboard Size 700×400
Create YTD, PYTD & % diff, which is filterable by a date range.
Create a Date Switcher which controls whether you are looking at Month or Week on the line chart
Max Calcs = 7
YTD – means upto and including today’s date. Use a DataSource Filter to exclude anything after todays date!
I think I have found the perfect use case for using INCLUDE LODs. It allows you to get what you need for the YTD & PYTD but also are affected by the date range filters
Dataset
This challenge uses Sample Superstore data which you can find here on Data.World
Attribute
When you publish your solution on Tableau Public make sure to take the time and include a link to the original inspiration. Also include the hashtag #WOW2024 in your description to make it searchable!