2025 Week 53 | Sigma : Can you build a pareto chart?
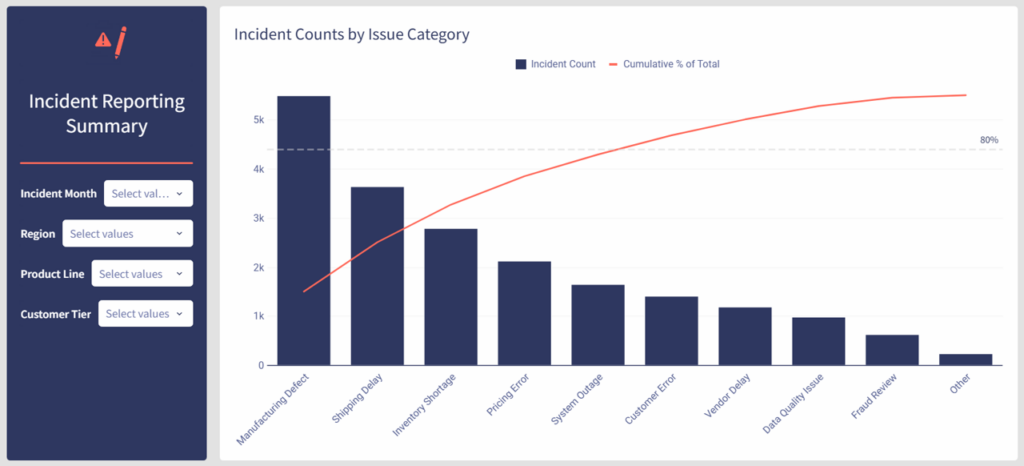
Introduction Welcome to the final week of 2025! Since it’s a holiday week, we’re keeping things simple with a classic but powerful visualization: the Pareto chart. Your challenge this week is to build a Pareto chart in Sigma that highlights which issue categories contribute the most to overall incident reports. By combining a sorted bar […]
2025 Week 53 | Sigma : Can you build a pareto chart? Read More »