Introduction
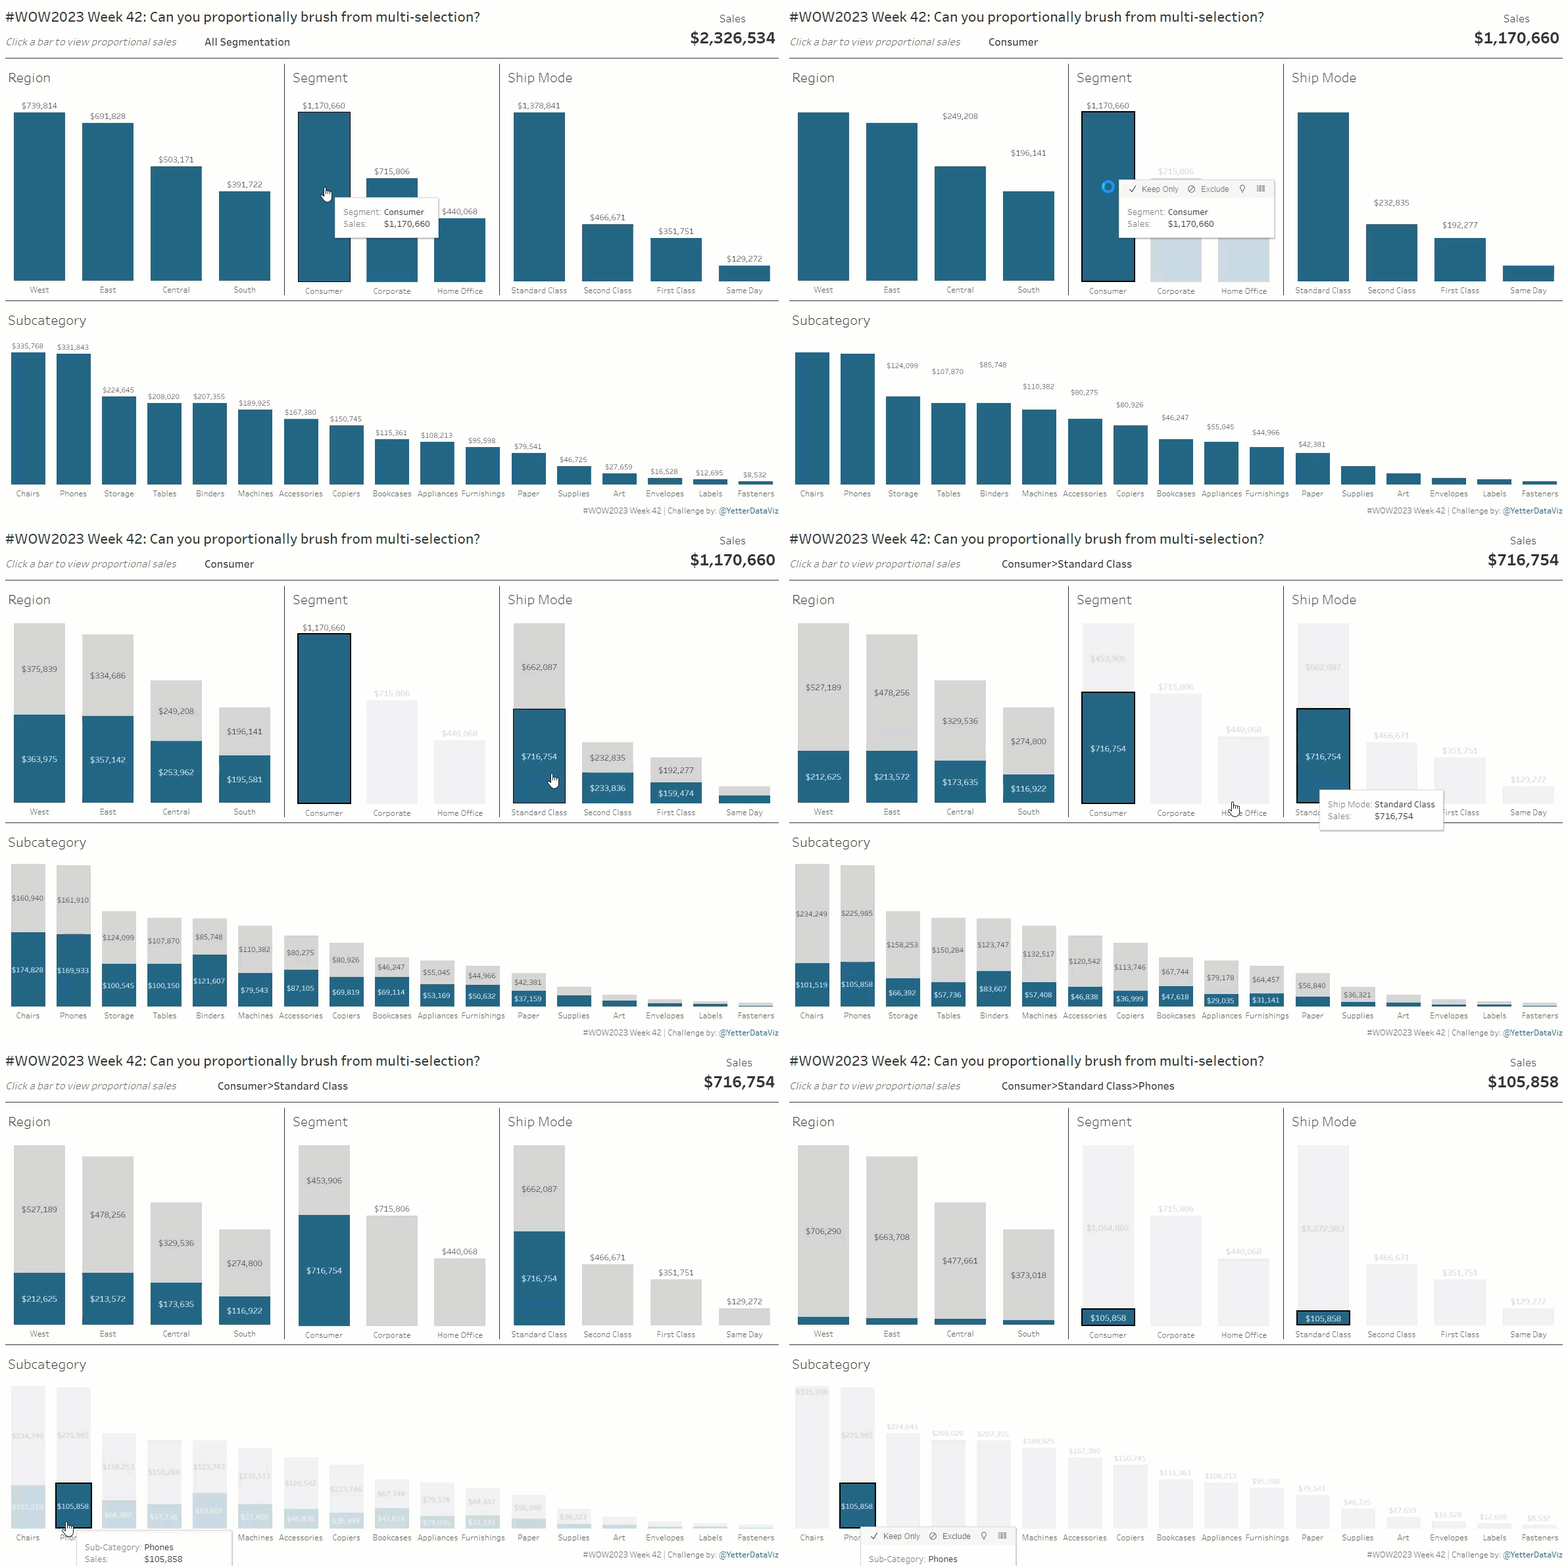
This week’s challenge is another inspired by my everyday work. As we launch new features, we look at how different segments of users engage with them. We wanted a smooth way to click into the segment combinations that were of interest, without having to go back to the top to change a bunch of filters, so we landed on this solution which uses proportional brushing from multiple segment areas. Enjoy!
Requirements
- Dashboard Size: 1200 x 800px
- Create 4 bar charts showing Sales by:
- Region
- Segment
- Ship Mode
- Subcategory
- When selecting a bar, all other bars should highlight the Sales from the selected bar. If additional bars are selected, they will have an additive effect, further filtering the highlighted sections.
- Create a BAN showing total Sales for the selected segmentation
- Create a breadcrumb showing what has been selected and is therefore highlighted. When nothing has been selected, it should display ‘All Segmentation’
Dataset
This week uses the Superstore data set. You can find it here on Data.World
Attribute
When you publish your solution on Tableau Public make sure to take the time and include a link to the original inspiration. Also include the hashtag #WOW2023 in your description to make it searchable!

Share
After you finish your workout, share on Twitter and/or LinkedIn using the hashtag #WOW2023 #Tableau and tag @WorkoutWednsday
