Introduction
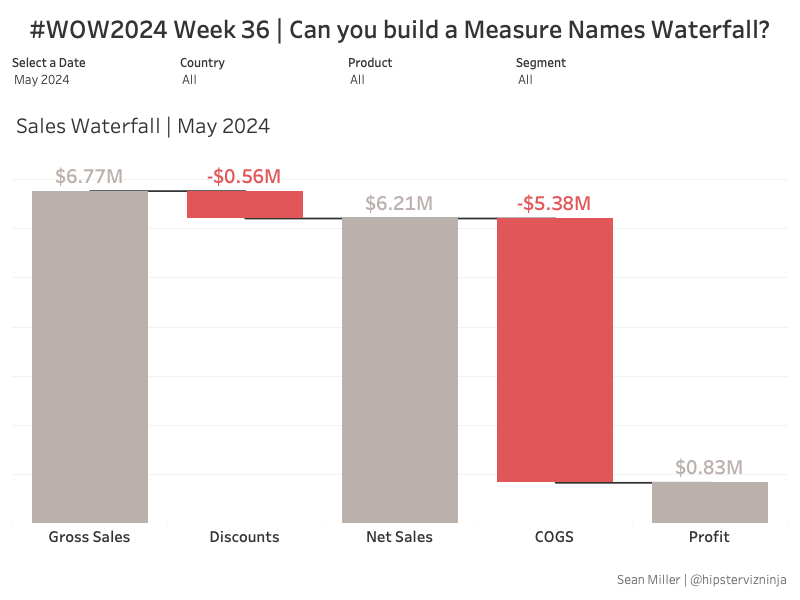
Welcome back to another challenge. This week we’re tackling some financial data and in particular, a waterfall chart based on multiple measure columns.
Can you handle it?
Requirements
Dashboard Size 800 x 600
One worksheet
Create a waterfall chart for
- Gross Sales
- Discounts
- Net Sales
- COGS
- Profit
- Create the guidelines across each step
- Match formatting
- NO PIVOTING DATA!
Dataset
This challenge uses a financial sales file. You can get it from my GitHub
Attribute
When you publish your solution on Tableau Public make sure to take the time and include a link to the original inspiration. Also include the hashtag #WOW2024 in your description to make it searchable!

Share
After you finish your workout, share your solution:
- On Twitter using the hashtag #WOW2024 #Tableau and tag @WorkoutWednsday, @whereismytrain and @_hughej
- On LinkedIn using the tag Workout Wednesday, Tableau, Valerija Kirjackaja and Erica Hughes
