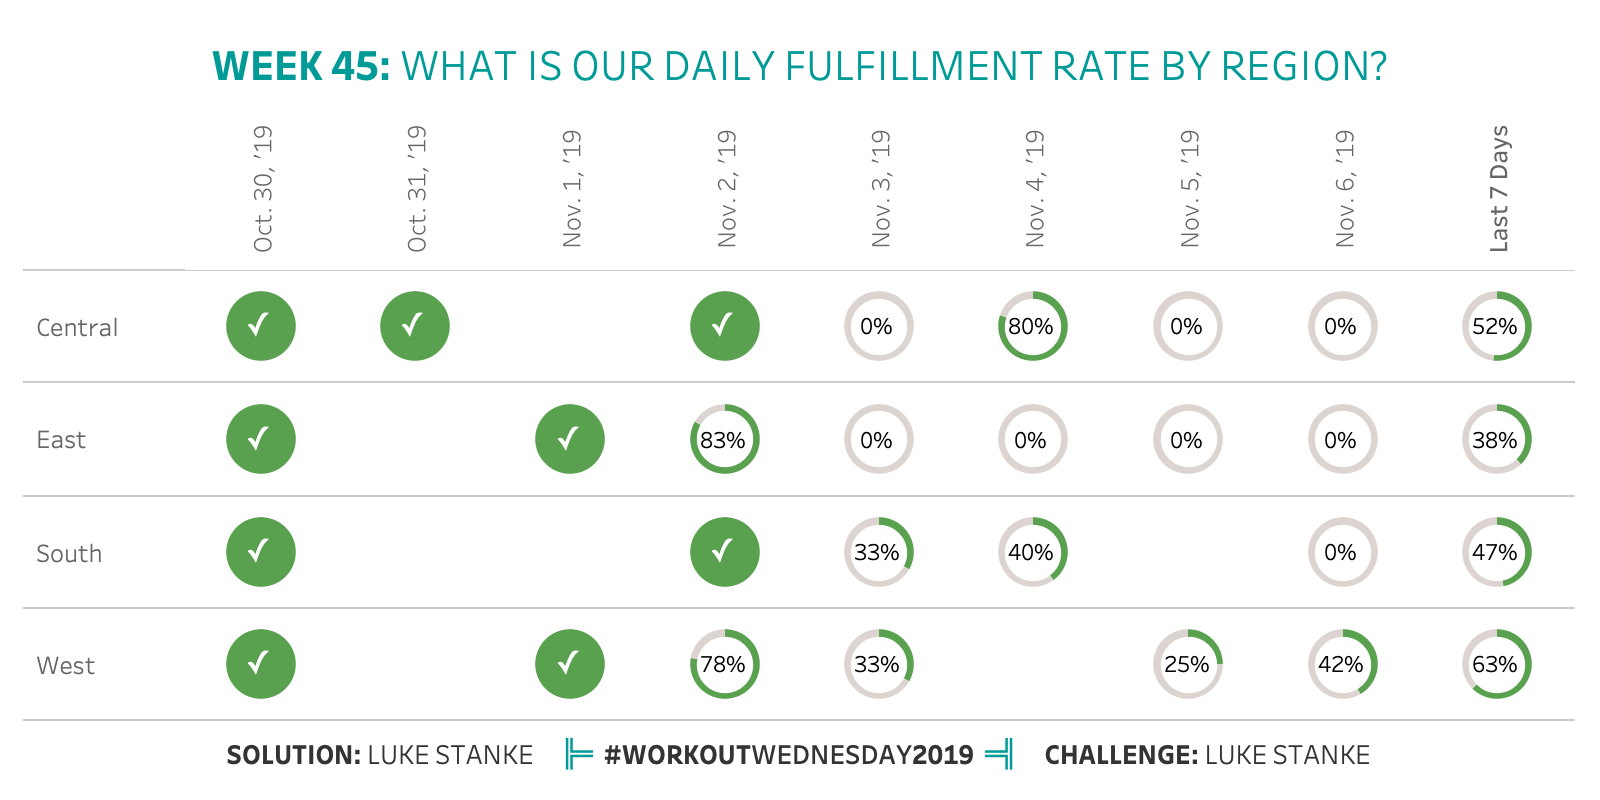
For this week’s challenge I was working on our own internal dashboards trying to show progress to a series of targets and landed on the this week’s challenge! This one combines my favorite chart type: the donut chart with the humble checkmark. – LS
Challenge
Click image to view on Tableau Public
Requirements
- Format: 800px by 400px
- Filter the data to November 6th, 2019.
- Orders for the last 7 days.
- Create a donut chart that shows the percent of orders that have been shipped as of November 6th, 2019 by day and region.
- If 100% of orders have been shipped show a green dot with a checkmark.
- Show aggregates for the last 7 days.
- Match formatting.
- **ADVANCED** Without using any sort of data densification (including table calcs), show gray dots for the day-region combinations where there were no orders.
Dataset
This week uses the superstore dataset for Tableau 2019.1. You can get it here at data.world
Share
After you finish your workout, share on Twitter using the hashtag #WorkoutWednesday2019 and tag @AnnUJackson, @LukeStanke, @lorna_eden, and @curtisharris_!
Track your progress
Also, don’t forget to track your progress using this Workout Wednesday form.
Attribute & Tag
When you publish your solution on Tableau Public make sure to take the time and include a link to the original inspiration. Don’t forget to add the hashtag #WorkoutWednesday2019, as well!


Hi Luke,
a nice and simpler one, this week.
Her’s my shot: http://bit.ly/2019w45-ww
Added a moving dat, and some cooler tooltips
Hi
I like this exe’s, but I haven’t been able to solve it, where can I see the solution to replicate it?
Thanks