Introduction
Welcome to the second to last week of the #WOW2021! As we look to close out 2021 and our 5th year of WorkoutWednesday, let’s take a look at how the community uses the submission tracker.
Do most submissions happen the same week of the challenge or do people back fill?
Do people start off submitting early in the year and then later forget?
Requirements
- Dashboard Size: 1100px by 846 px
- # of Sheets – 3
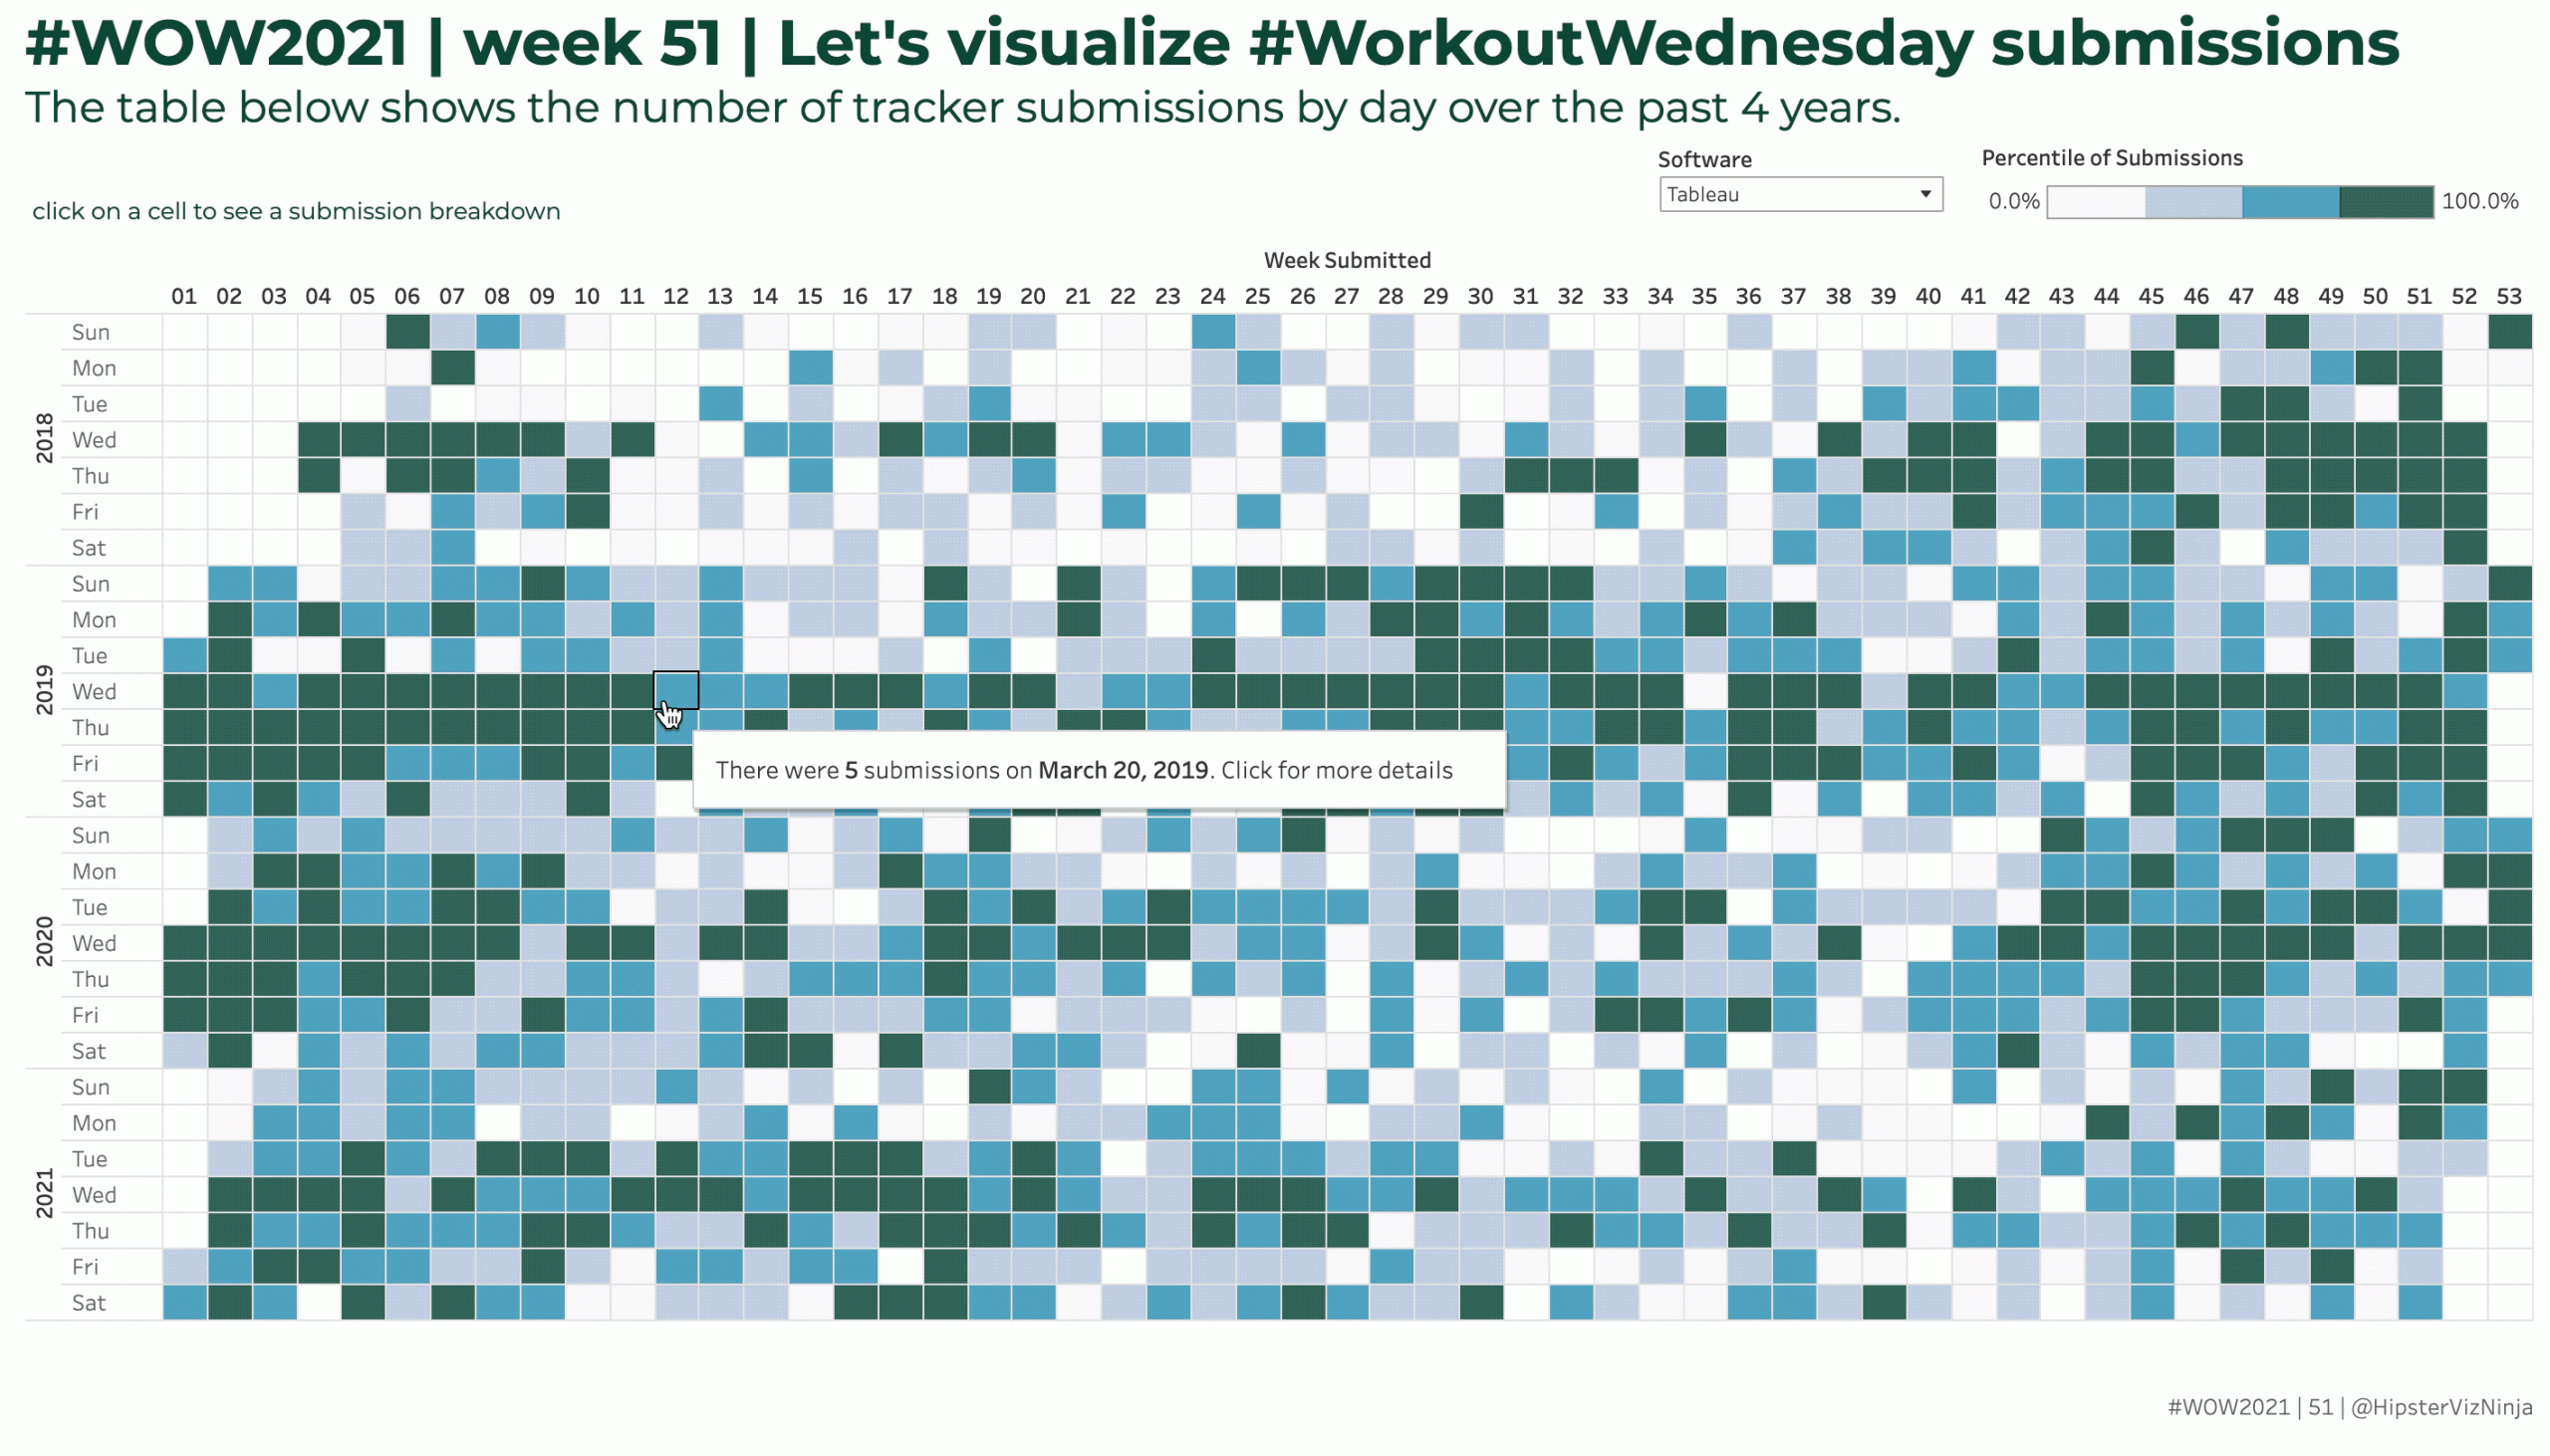
- Create a highlight table by day showing the number of submissions for each day
- The color of the boxes is percentile rank for submissions by day stepped by quartile.
- The color I used is color brewer PuBuGn.
- You can get the Color Brewer .tps file here and add it to your local .tps file
- Add interactivity such that when you click on a day, the following happens
- a chart showing how many submissions were from that week’s challenge and how many were from other weeks
- a detail table show which individual challenges were submittted.
- When you clear the selection, the highlight table should reset and take the entire dashboard.
- Add a filter to allow users to select between software
Dataset
This week uses a deidentified version of the submission tracker through 12/21/2021. You can get it here at data.world
Attribute
When you publish your solution on Tableau Public make sure to take the time and include a link to the original inspiration. Also include the hashtag #WOW2021 in your description to make it searchable!

Share
After you finish your workout, share on Twitter using the hashtag #WOW2021 and tag @AnnUJackson, @ItsCandraM, @LukeStanke, @_Lorna_Brown and @HipsterVizNinja
