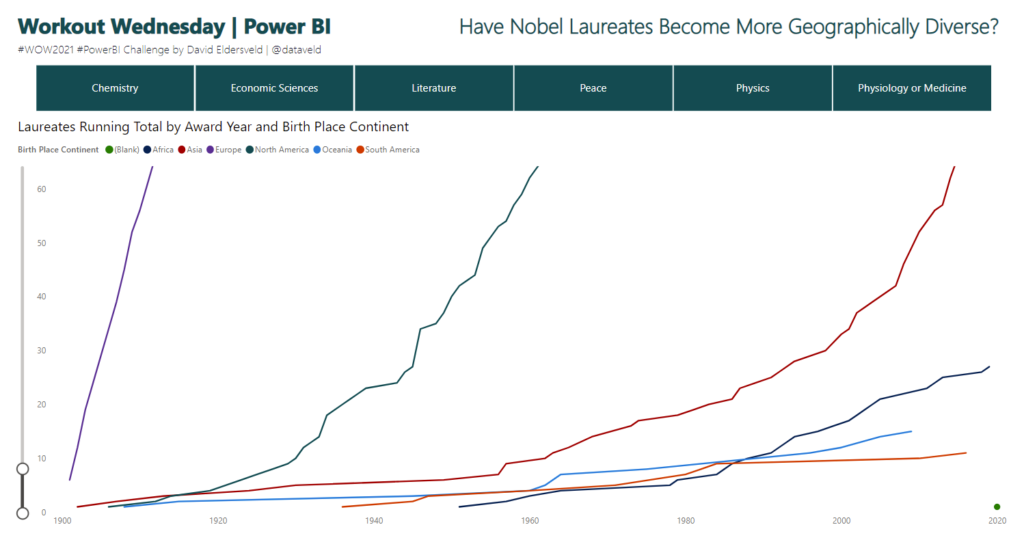
2021 Week 23 | Power BI: Can You Build a Cumulative Line Chart?
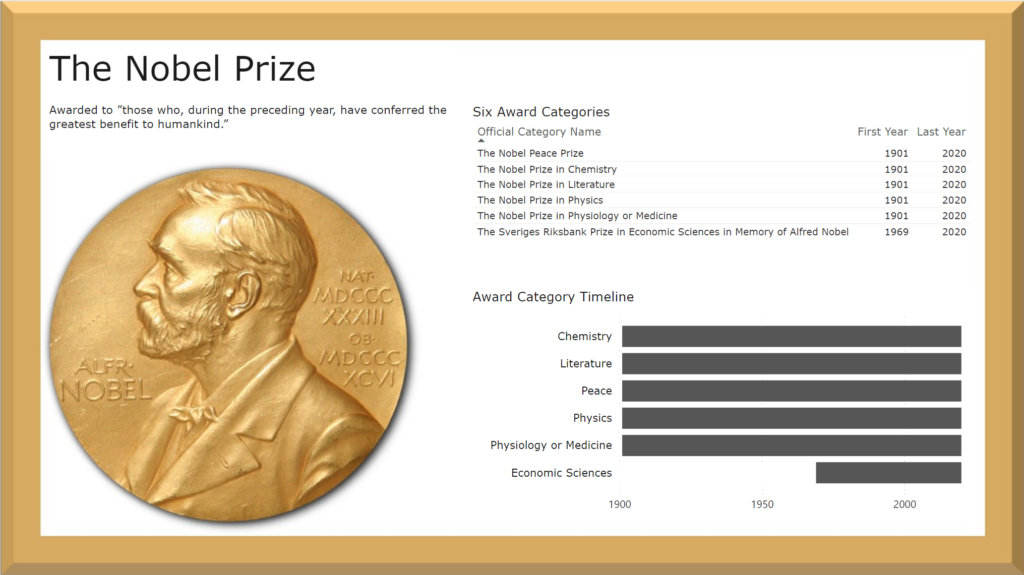
Introduction Continuing with the Nobel Prize data that Meagan began exploring last week, this week extends to consider aspects of individual Nobel laureates. The main visual is a cumulative line chart, but you’ll also provide detail on laureates with a report page tooltip. While additional JSON expansion and transformation was required from the original dataset, …
2021 Week 23 | Power BI: Can You Build a Cumulative Line Chart? Read More