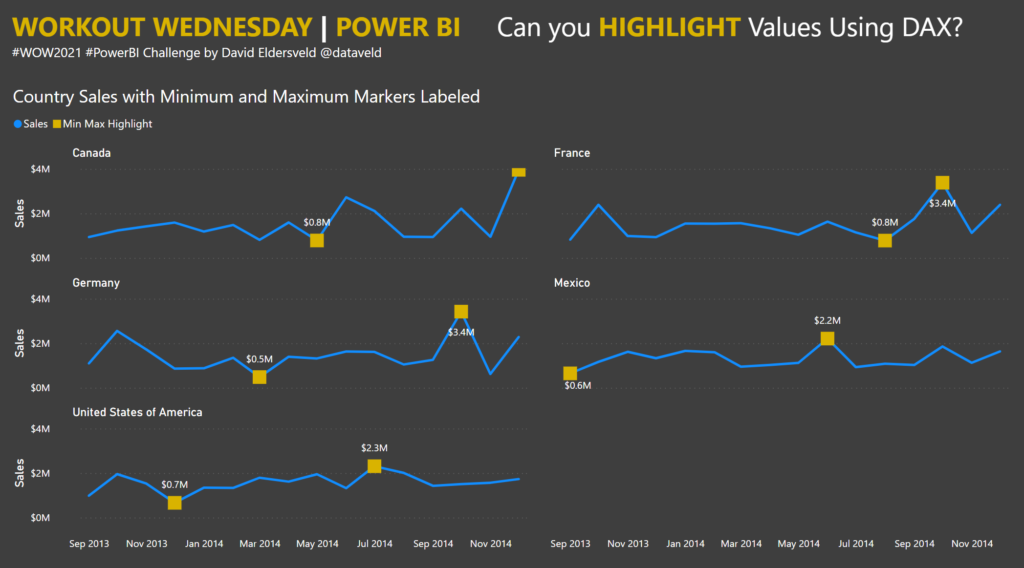
2021 Week 19 | Power BI: Can you Highlight Values Using DAX?
Power BI Highlights with DAX
Power BI Highlights with DAX
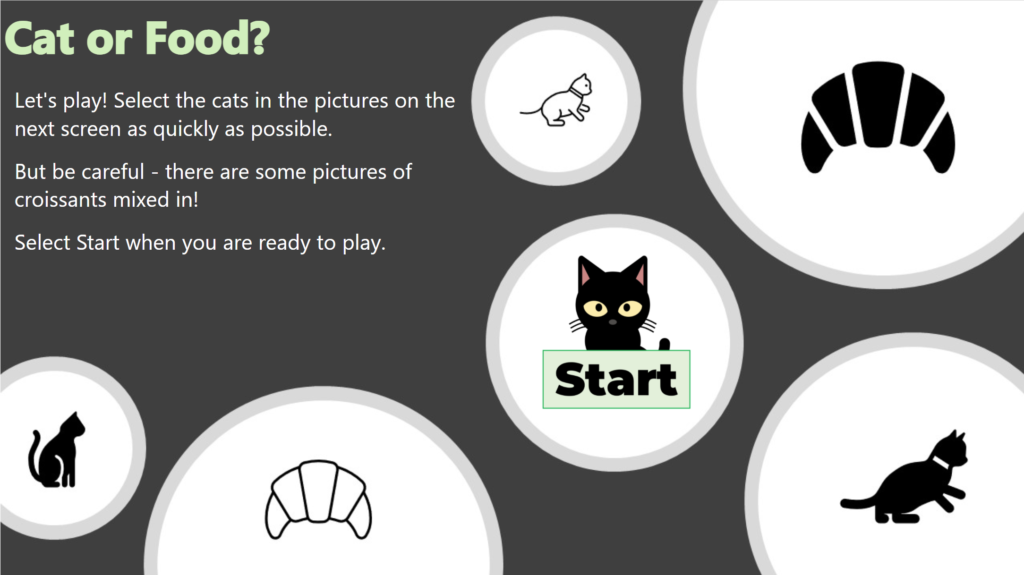
Introduction The Power BI Workout Wednesday team has decided that May is made for DAX! Each challenge this month will require some DAX in the solution. We are going to start our month of DAX with a fun game called Cat or Croissant. You might be familiar with the many versions of “animal or food” …
2021 Week 18 | Power BI: DAX Trick – Cat or Croissant Read More
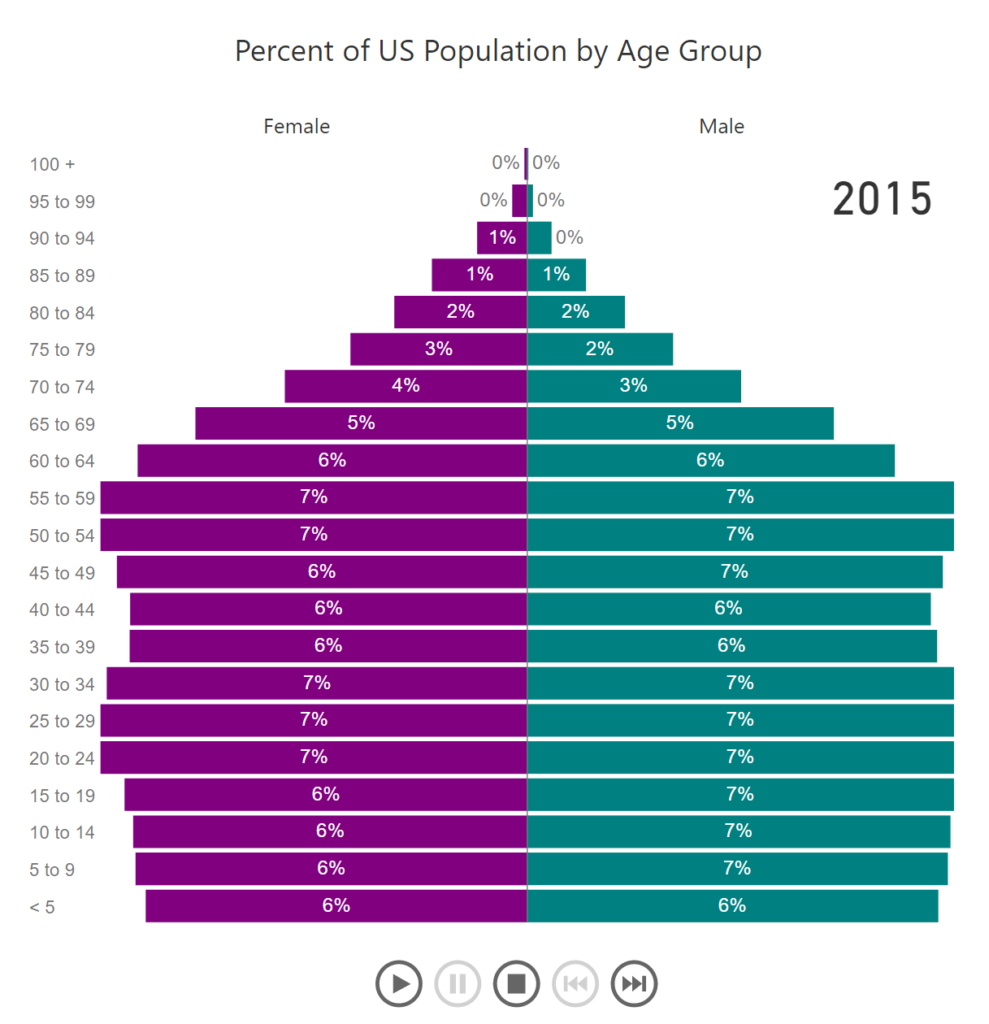
Introduction It’s week 17 and we’re back to create what demographers refer to as an Age Pyramid, in which each bar represents the makeup of the US population as a whole in 5 year cohorts. The inspiration for this visual came from the Pew Research Center’s 2014 publication in which they visualized “America’s Morphing Age …
Introduction Thanks to everyone who has ben participating in #WorkoutWednesday – Power BI edition! We have had an amazing 953 submissions for the Power BI challenges at the time of writing this post. If you haven’t been submitting your tracker upon completion, make sure to fill it out at this link. This week we are …
Power BI Conditional Formatting using Background Color, Font Color, and Icons
Power BI Conditional Formatting using Background Color, Font Color, and Icons
Power BI Conditional Formatting using Background Color, Font Color, and Icons
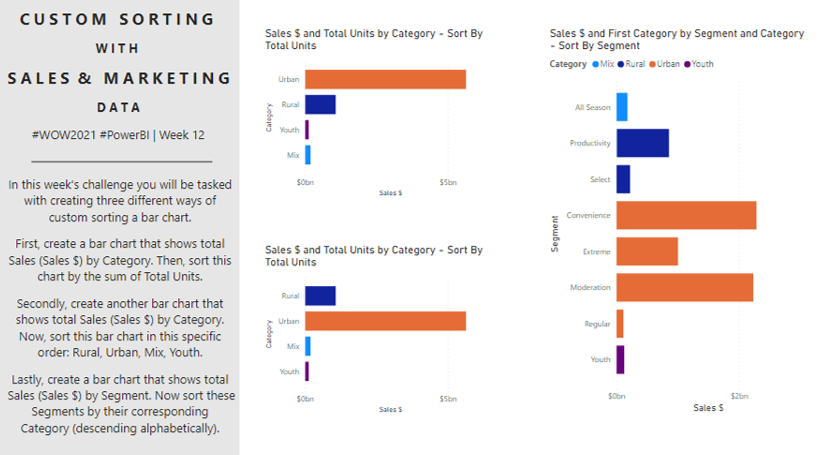
Introduction Thanks to everyone who has ben participating in #WorkoutWednesday – Power BI edition. This week we are going to be diving into a couple of different ways to custom sort your data. End users will often ask for specific sorting order, so figuring out how to do this in Power BI can be extremely …
Power BI Conditional Formatting using Background Color, Font Color, and Icons
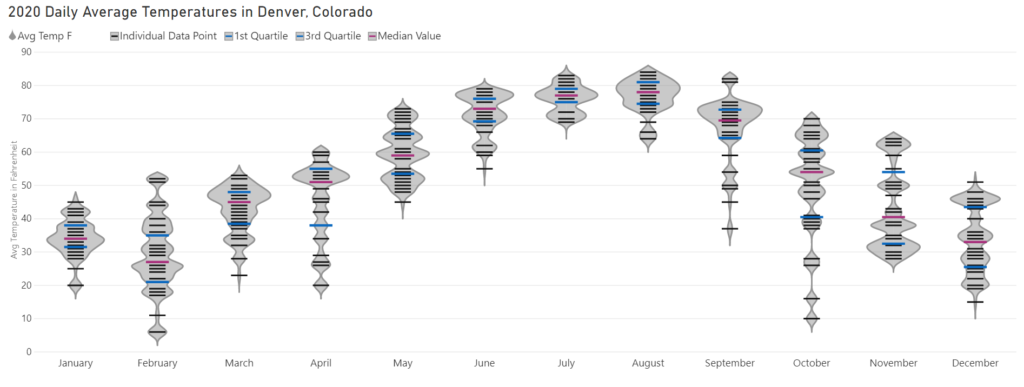
Introduction Thanks for joining us for Week 10 of Workout Wednesday – Power BI Edition. This week our challenge is to use the Violin Plot custom visual. There are no dependencies on prior weeks for this workout, so feel free to jump right in. Custom visuals are additional visuals created by Microsoft and Microsoft partners …
2021 Week 10 | Power BI: Violin Plot Custom Visual Read More