Sigma

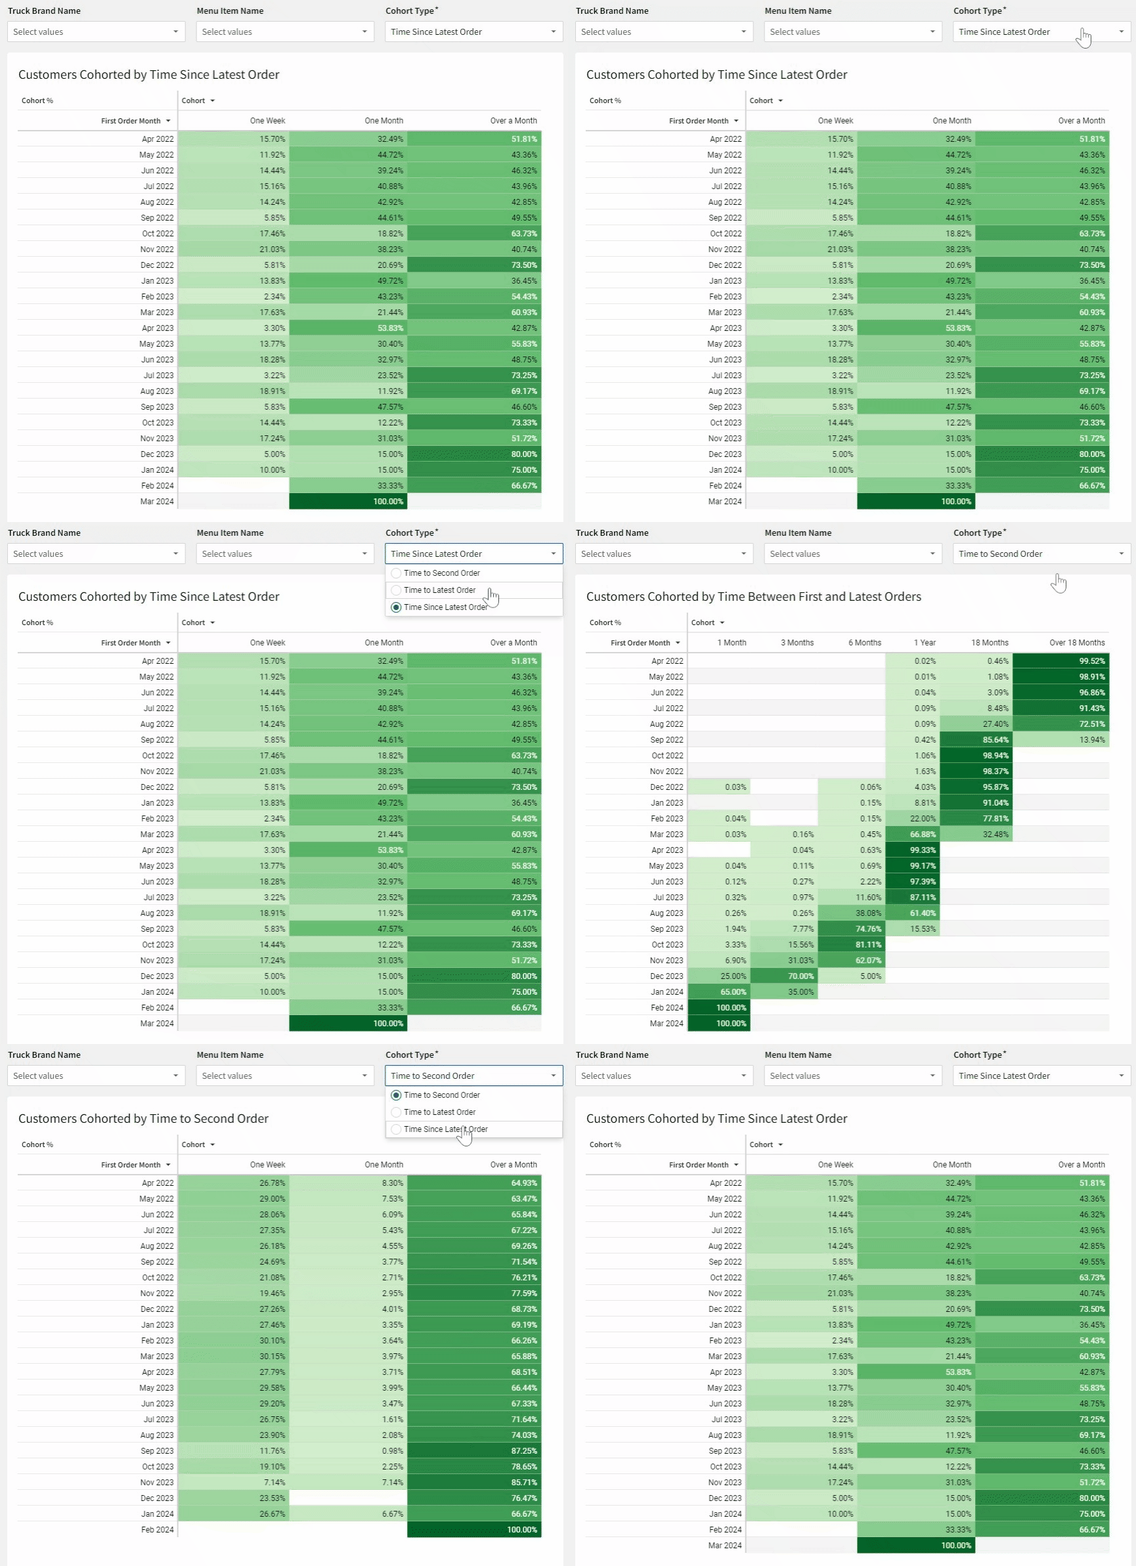
2024 Week 17 | Sigma: Can you Cohort These Customers?

Introduction Welcome to Week Seventeen! This week, you’re going to perform a Cohort Analysis of food truck customers based on when they placed their first order.  Conditional formatting will help highlight which cohorts have a greater percentage of customers in them. As a bonus, you will implement a dynamic page control input to let the …

2024 Week 17 | Sigma: Can you Cohort These Customers? Read More »

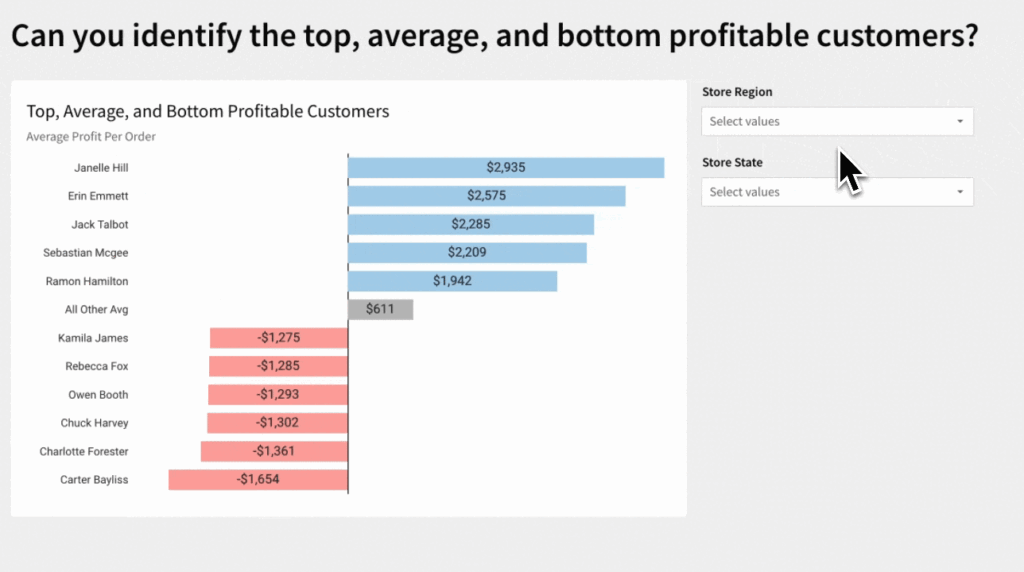
2024 Week 15 | Sigma: Can you identify the top, average, and bottom profitable customers? 

Introduction This week, we’re building a staple in my bar chart library: Top, Bottom, and Other Values. I often use this bar chart to easily show the breadth of the outliers while not losing sight of the typical. This challenge is also a great example of the flexibility of modeling at different levels of granularity …

2024 Week 15 | Sigma: Can you identify the top, average, and bottom profitable customers?  Read More »

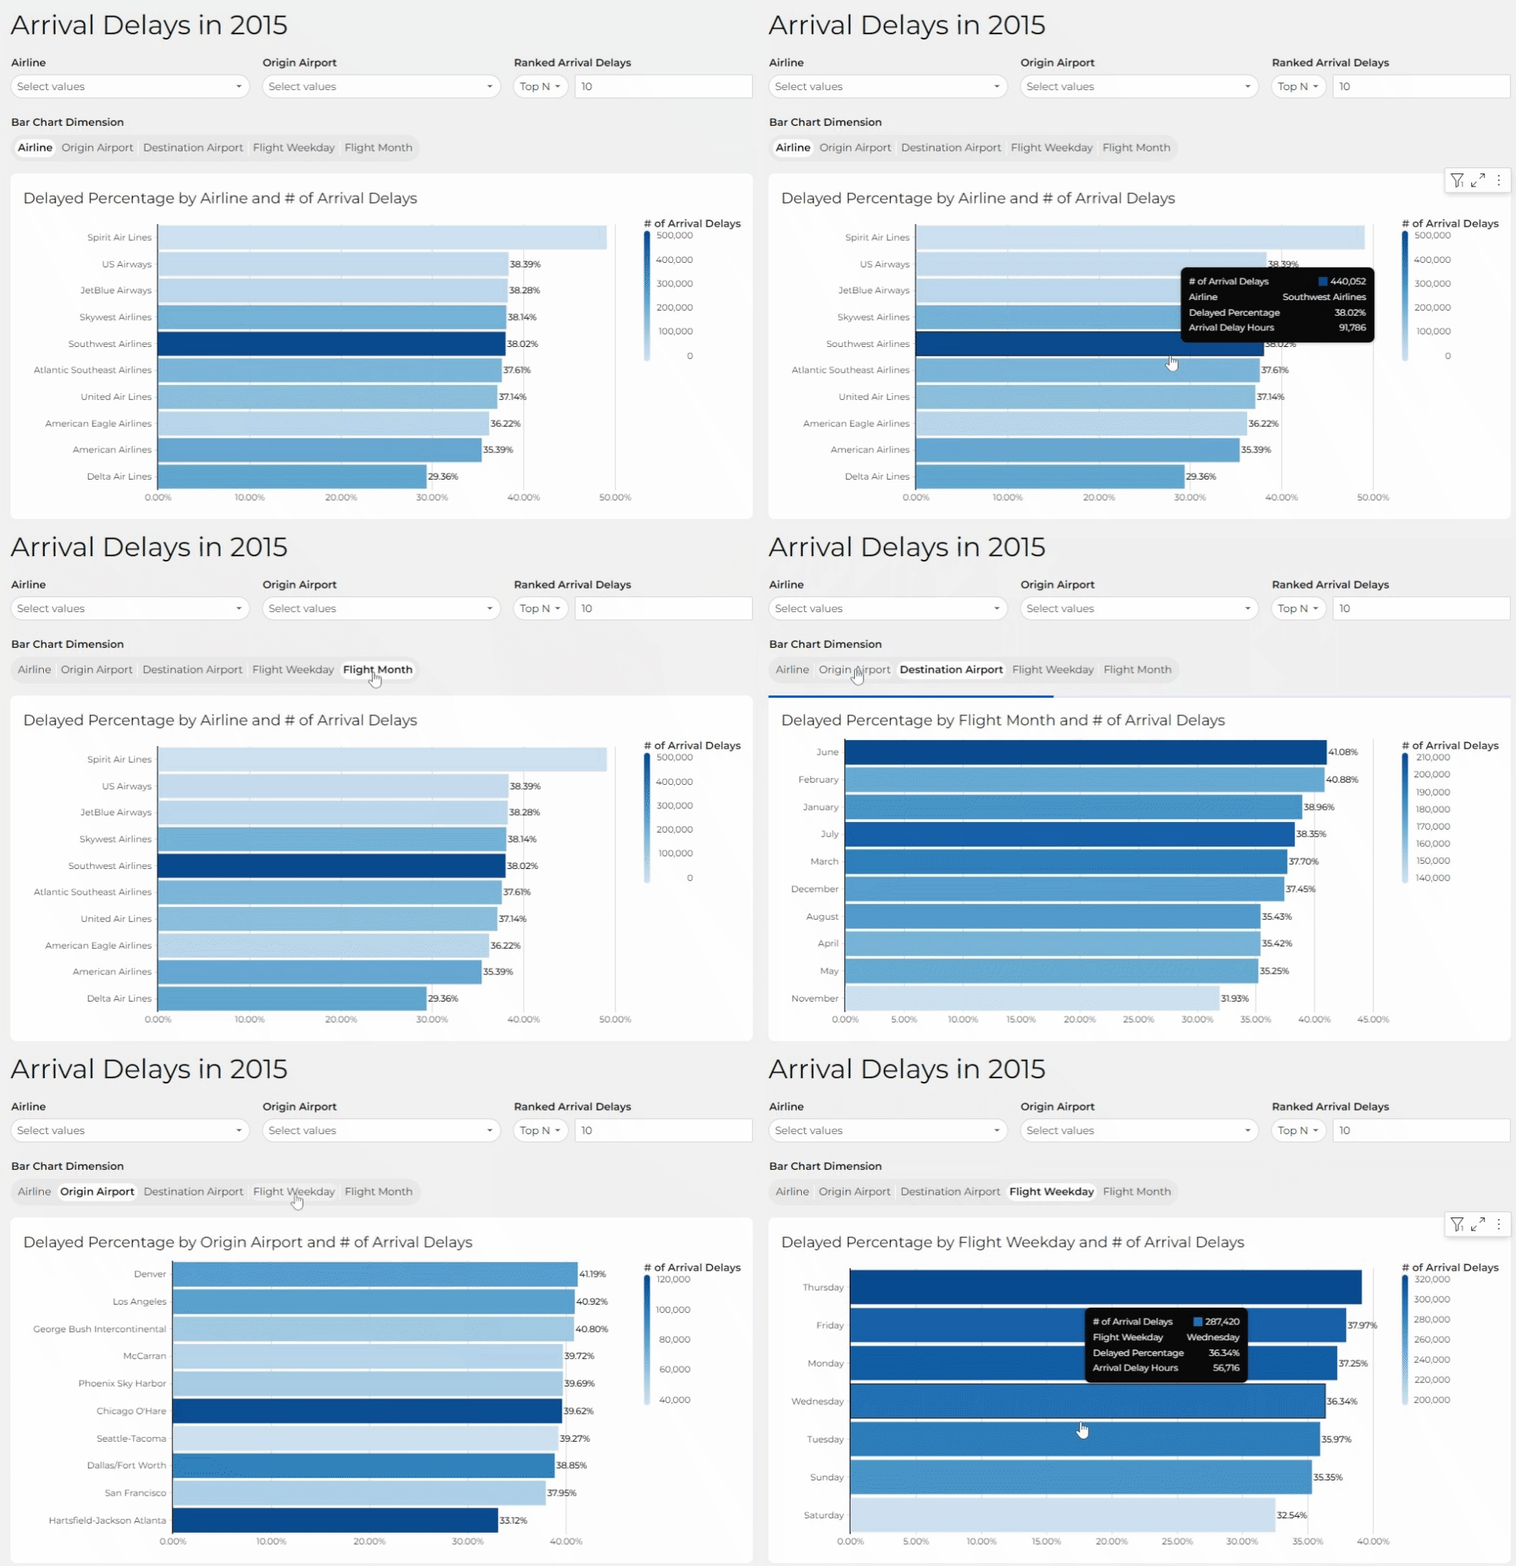
2024 Week 14 | Sigma: It’s a Bird… It’s a Plane… It’s Lookup Functions!

Introduction Welcome to Week Fourteen! This week, you’re going to learn about Sigma’s Lookup function.  Lookups are very useful for joining information from one data source to another, without accidentally fanning your data.  Sigma also has a Lookup Wizard for a foolproof way of utilizing this function. When I book a flight, I am particularly concerned …

2024 Week 14 | Sigma: It’s a Bird… It’s a Plane… It’s Lookup Functions! Read More »

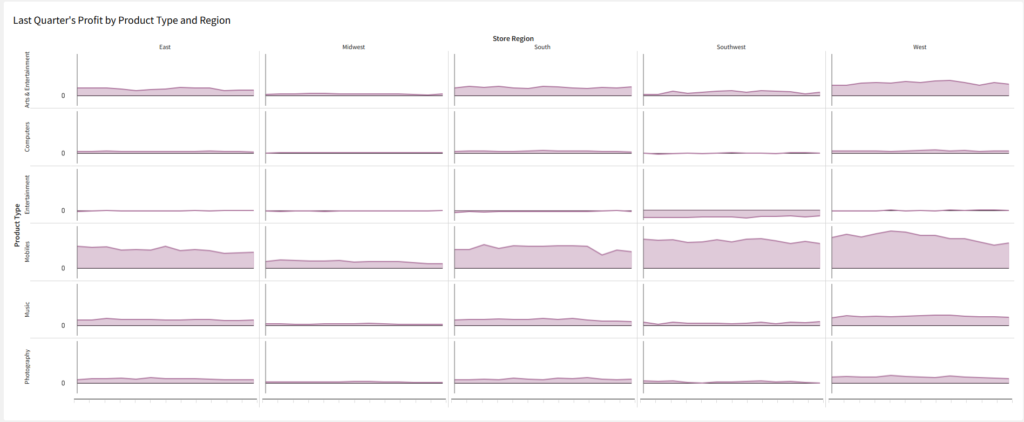
2024 Week 12 | Sigma: Can you take Action?

Introduction For this week’s challenge, we’re exploring Sigma’s workbook actions, a powerful feature that enables better end-user experiences, nuanced data exploration, and more impactful presentations. Sigma’s workbook actions cover a wide range of interactions, but for this first challenge, we’ll focus on two common action scenarios: clicking to filter and clicking to change.  As you …

2024 Week 12 | Sigma: Can you take Action? Read More »

2024 Week 11 | Sigma: Can you find the Subtotal?

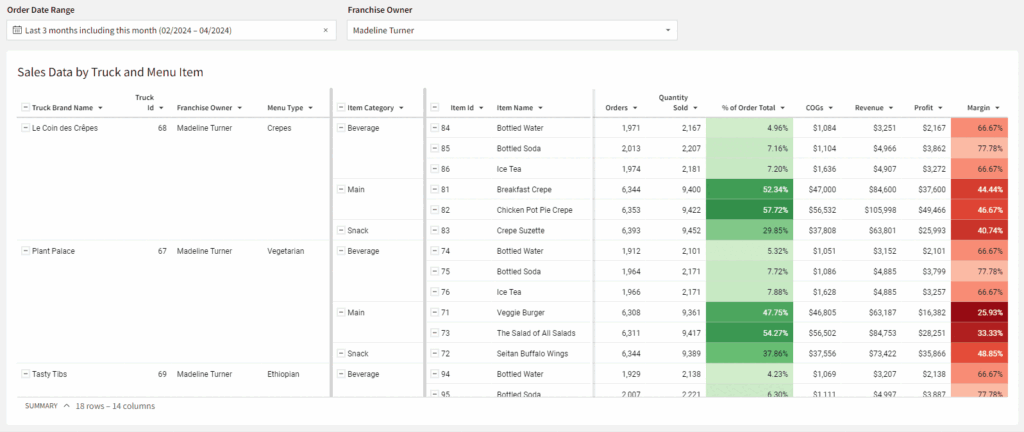
Introduction Welcome to Week Eleven! This week, you’re going to learn about Sigma’s Subtotal, PercentOfTotal, and GrandTotal functions.  I find these functions particularly useful in adding context to ToolTips or Pivot tables. In this challenge, you will explore the various types of subtotaling functions.  As you work through this challenge, think about the story the different …

2024 Week 11 | Sigma: Can you find the Subtotal? Read More »

2024 Week 9 | Sigma: Can you create Bar charts in this Pivot Table?

Introduction This week have a guest author! Tausif Kazi is an expert in data visualization who is experienced in several platforms such as Sigma, Power BI, Tableau, and Snowflake.   Connect with Tausif:Linkedin: https://www.linkedin.com/in/tausifkazi/Twitter: https://twitter.com/VizByTK This challenge will cover how to create a Bar chart in Pivot Tables. This will help your users quickly understand the …

2024 Week 9 | Sigma: Can you create Bar charts in this Pivot Table? Read More »