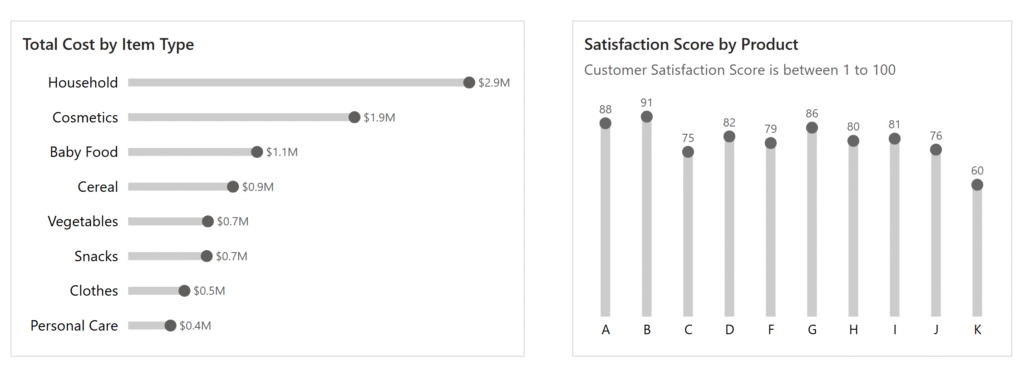
2025 Week 22 | Power BI: Create a lollipop chart
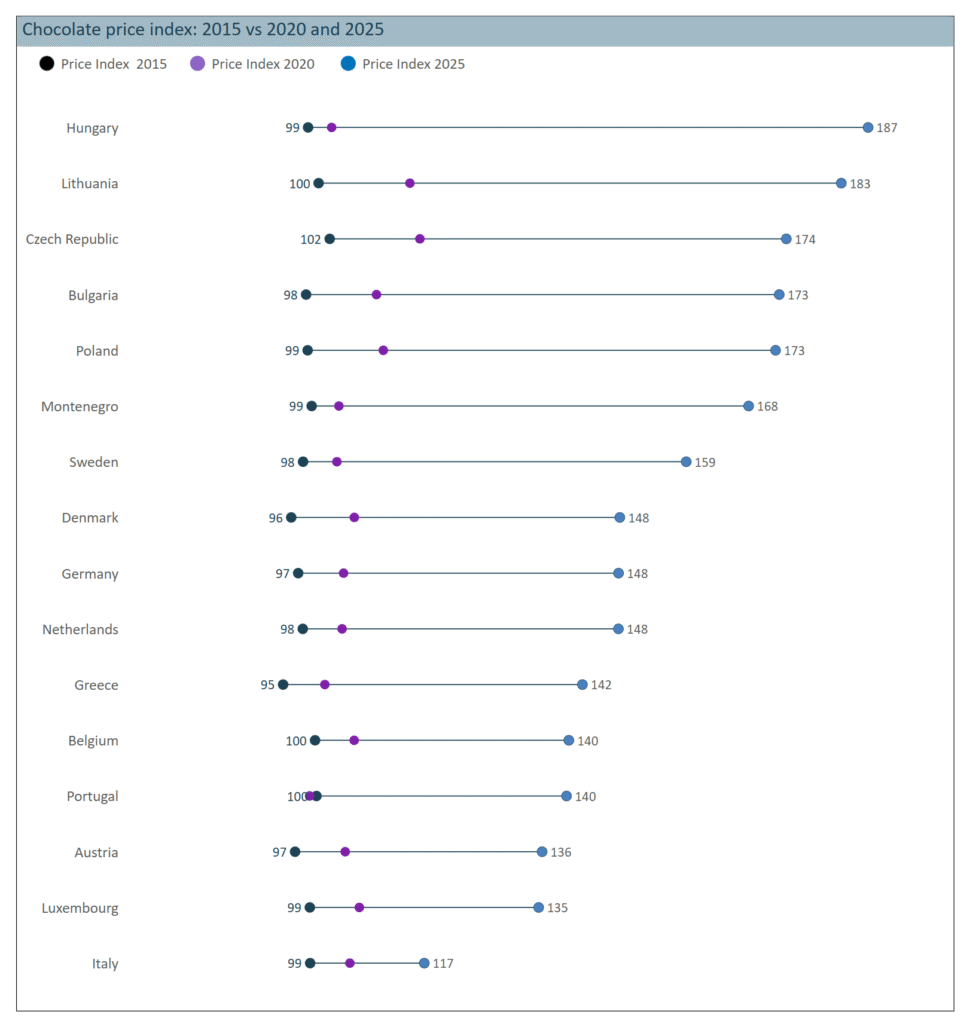
Introduction Happy Wednesday Power BI Folks! This is my first time creating a Power BI Workout Wednesday exercise, and I’m excited (and a little nervous) to share it with you all! Thank you for being part of my learning and teaching journey. Let’s grow together! Have you ever wanted to create a Lollipop Chart in Power BI …
2025 Week 22 | Power BI: Create a lollipop chart Read More »