Introduction
One of the inciting factors for the CRMA WorkoutWednesday was this collaborative Tableau challenge last year. I attempted it in CRMA and actually got quite far. This week we’ll try something similar, with the hopes to be able to build on it for my next challenge in a couple of weeks. (We’ll see how that goes).
Requirements
- Create a recipe the transforms the data to be used in this dashboard
- There is an “opportunity” and an “opportunity history” table
- The history table has one record for each stage change that happened to any of the opportunities
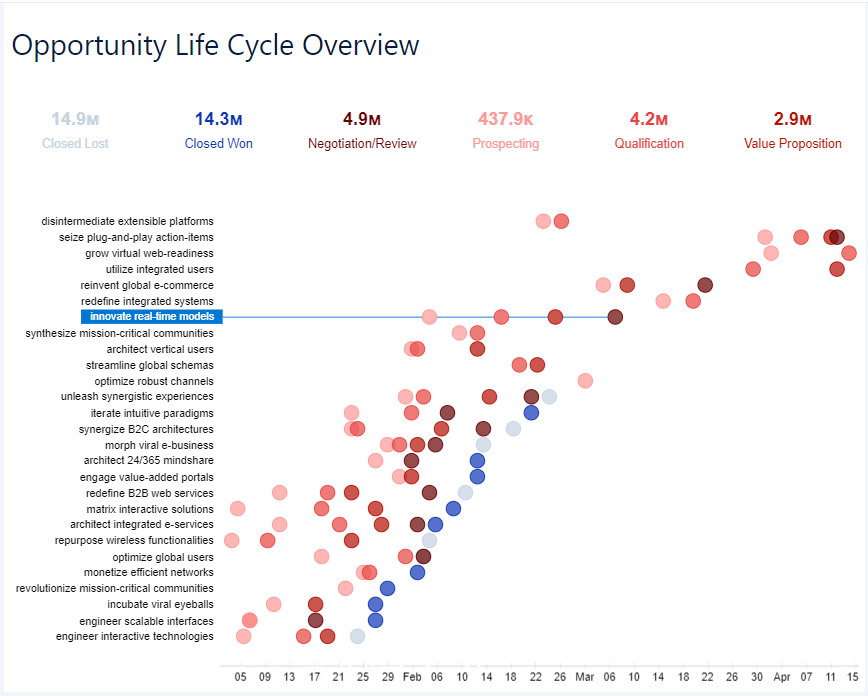
- Re-create the dashboard
- Create coloured KPIs with the amount of all the opportunities that are currently in the according stage
- Create a timeline dot plot with a row for each opportunity and a coloured dot for each time the opportunity changed its status
- Match the formatting in the image below (colours, axis, etc.)
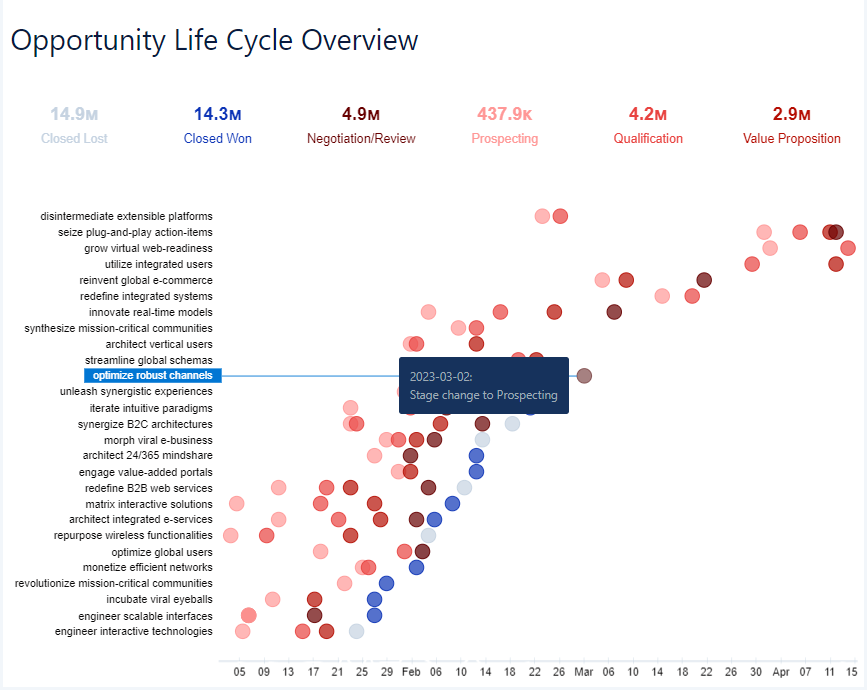
- Match the tooltip
The resulting dashboard should look something like this: