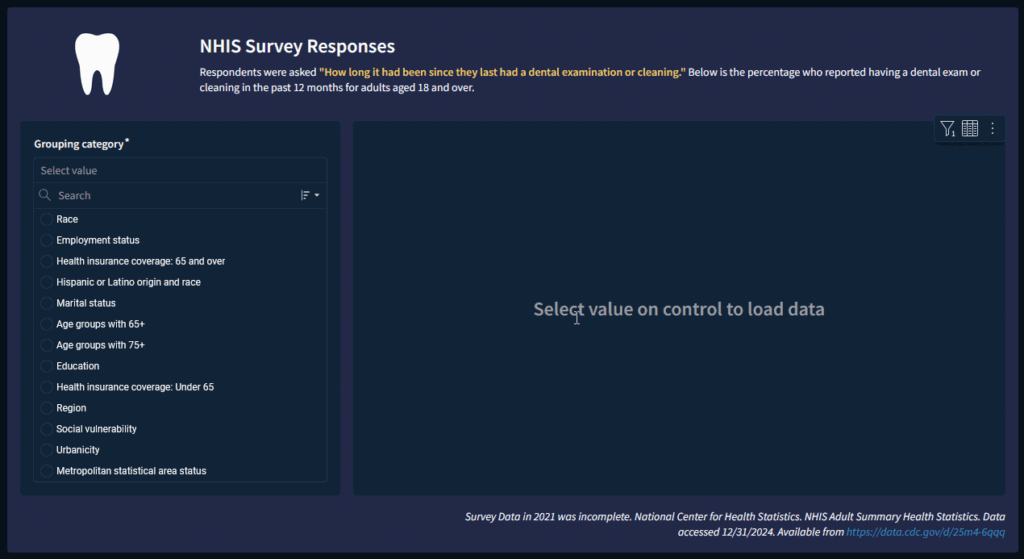
2025 Week 01 | Sigma: Can you visualize NHIS data?
Introduction Welcome to year 2 of Workout Wednesday, we’re here to help you keep good on your New Year’s resolutions of learning new skills and getting your teeth cleaned. The data for this week comes from the National Health Interview Survey (NHIS) website, which has a lot of interesting survey data to explore. They have …
2025 Week 01 | Sigma: Can you visualize NHIS data? Read More