
Introduction
We hope that you had a lot of fun with our mapping month in November where we focused a lot on maps and geospatial data in our challenges. This week we are going to be shifting gears and focusing on report design.
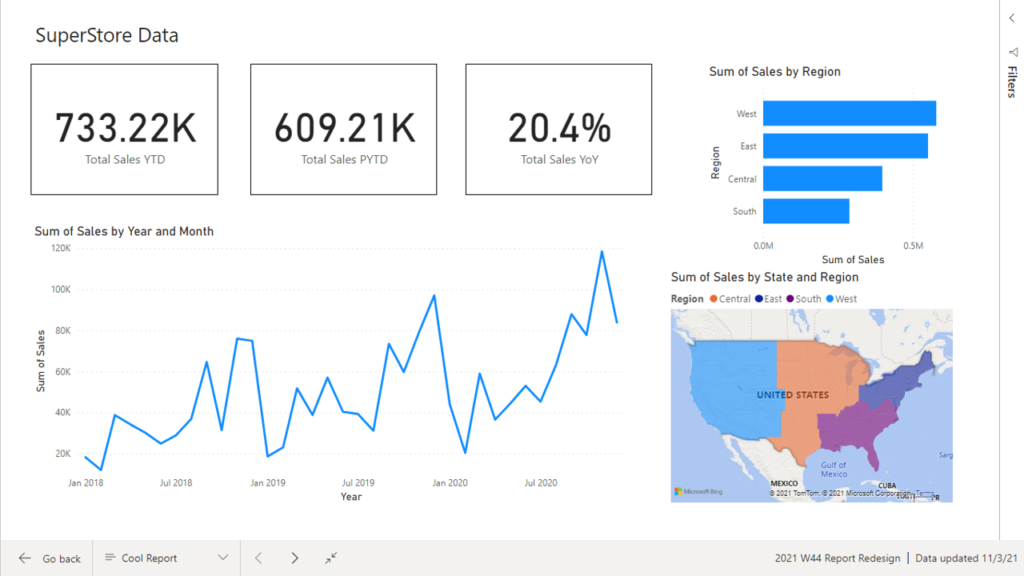
This week your challenge is to take a report that already has the data model defined, calculations created, and some of the visualizations already made, and turn it into a well designed report. In the report below you will see that I’ve already put some basic measures and charts onto the report canvas. This dataset is the same Super Store data set that has been used in several previous challenges.
Requirements
- Downloade the Super Store PBIX file from data.world
- Use some of the existing measures and charts to create your own report
- Make sure to post your revamped report to social media so we can see the awesome looking reports that you all have made!
Dataset
This challenge uses the PBIX report provided on data.world that uses the Super Store datset that have used in previous exercises. You will need to log in to data.world to retrieve the data, but accounts are free.
Share
After you finish your workout, share on Twitter using the hashtags #WOW2021 and #PowerBI, and tag @JSBaucke, @MMarie, @shan_gsd and @dataveld. Also make sure to fill out the Submission Tracker so that we can count you as a participant this week in order to track our participation throughout the year.