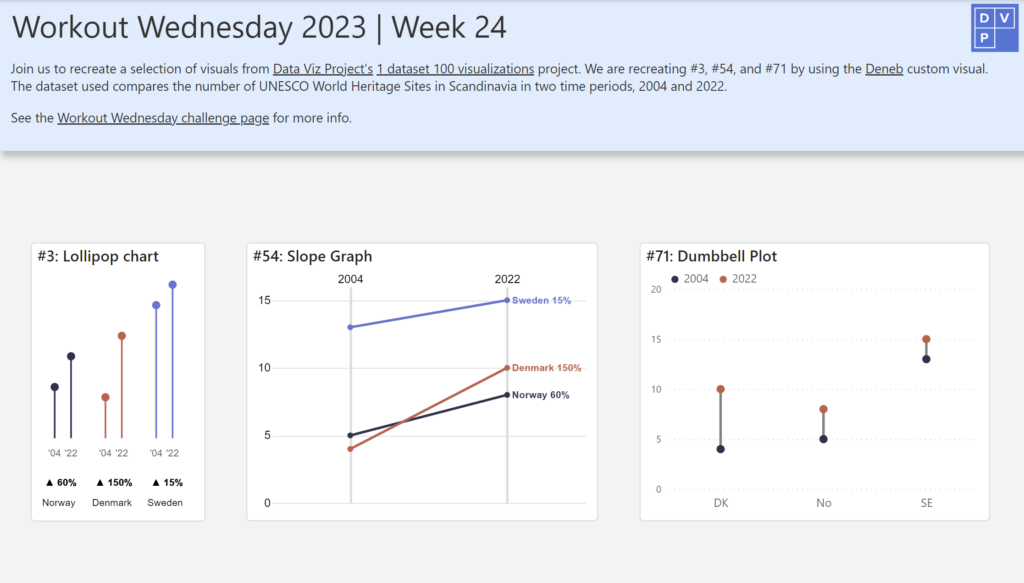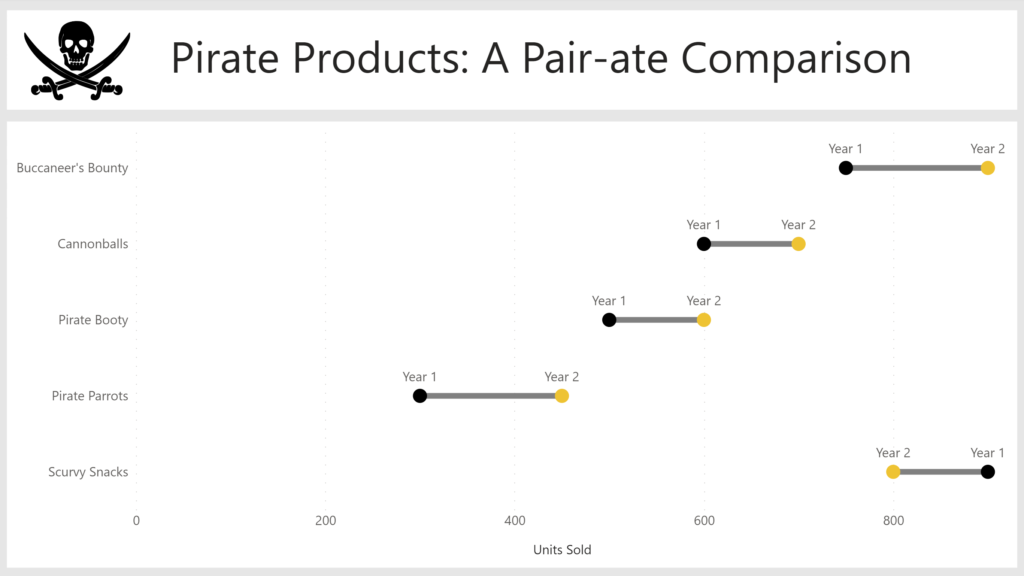
2023 Week 45 | Power BI: Create a dumbbell chart with Deneb
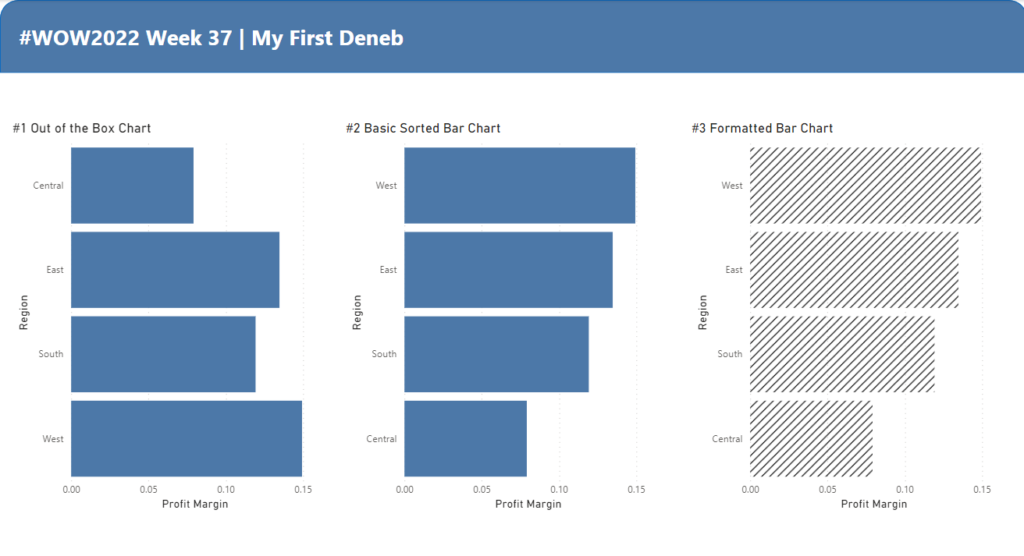
Introduction Welcome back to Workout Wednesday! This week we’re creating a dumbbell chart to compare 2 sets of values using Deneb! If this is your first time using Deneb I highly recommend you play around with either the Vega or Vega-lite languages in the online editor, where you can load the code from examples, amend it, …
2023 Week 45 | Power BI: Create a dumbbell chart with Deneb Read More »