Introduction
I sit back every week and watch the other amazing members of the #WorkoutWednesday Power BI team go through Deneb challenges like it’s nothing. The visuals are fantastic, the customizations are intriguing, but the truth is – I’ve never done a Deneb visual! Until this week that is.
If you’re like me and have zero experience with Deneb, this challenge might be for you. If you have tons of experience with Deneb, you might want to skip this week. This week will give any beginners (like me) a decent intro into how people like Kerry Kolosko make insanely cool visuals with Power BI.
If you’re not familiar, Deneb is a custom visualization available in Power BI Desktop that uses Vega-Lite coding to produce custom chart as shown below. You can use this link to get started with some of the intricacies of the language.
You are going to create three visuals in this exercise: Out of the Box Bar Chart, a Sorted Bar Chart, and a Formatted Bar Chart.
The first visual will just be a bar chart using the built in functionality of Deneb. The second will be the same chart, but sorted by a measure. The last chart will be the same as the second with some formatting thrown in. Please read below for the instructions on how to achieve these three charts.
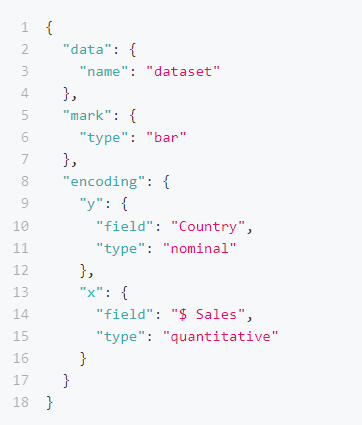
The basic Deneb code to create a bar chart is shown below. Some of the formatting that will take place is detailed in this link – http://vega.github.io/vega-lite/docs/bar.html
Requirements
- Obtain the data here: https://data.world/stanke/superstore-20214
- Import Deneb from the App Source
- Create a measure for Profit Margin
- Create your first Deneb visual and drag the Region and Profit Margin fields into the Values box
- Select Edit from the ellipses on your Deneb visual
- Choose Simple Bar Chart from the Vega-Lite options and map your fields to the appropriate fields in the bar chart template and hit Create
- You will now see a bar chart be created – hit Back to Report and you’ll see that the visual was created
- To create bar chart # 2, use the “sort”:”x” code to make the bars sort by the Profit Margin value – http://vega.github.io/vega-lite/docs/sort.html
- To create bar chart #3, use the “fill”:”url(….)” code to make the custom formatting of the bars – https://deneb-viz.github.io/pattern-fills
Dataset
This challenge uses the Tableau SuperStore dataset provided on data.world. You will need to log in to data.world to retrieve the data, but accounts are free.
Share
After you finish your workout, share on Twitter using the hashtags #WOW2022 and #PowerBI, and tag @JSBaucke, @MMarie, @shan_gsd, @KerryKolosko, and @NerdyWithData. Also make sure to fill out the Submission Tracker so that we can count you as a participant this week in order to track our participation throughout the year.
Please be sure to cite source before sharing.
Solution
This challenge uses the Tableau SuperStore dataset provided on data.world. You will need to log in to data.world to retrieve the data, but accounts are free.