
This week you will need to use your formatting skills and your knowledge with formatting color. You’ll also be using using the rarely-utilized hierarchy on this dashboard and you’ll need to utilize the “+” and “-” to drill in and out of the hierarchy.
Below are images and check out the version on Tableau Public
Requirements
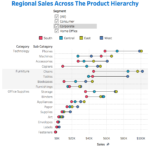
- The dashboard size is 600px by 800px
- You must use Category and Sub-Category in your product hierarchy.
- Right-align each member in the hierarchy.
- Sort each level in the hierarchy descending by sum of sales.
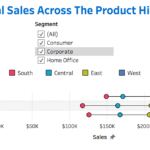
- Match the color on Region using a palette. You may not custom assign, you must assign a palette that comes with Tableau.
- Show “lines” going from the region with the lowest value in a member of the hierarchy to the highest level.
- Make sure the min/max “lines” also sits between a horizontal grid line.
- Make the “lines” between min/max values appear as a thin black line.
- Use Segment as a filter.
This week utilizes the Superstore dataset. You can get it here at Data.World
As you complete this example, feel free to share on Twitter using the #WorkoutWednesday hashtag. Don’t forget to tag @VizWizBI, @RodyZakovich, and @LukeStanke. We really want to see your work.
Also, if you want your efforts throughout 2018 tracked, feel free to fill out this Google Form.
Good luck!
Spoilers
- Seriously, there is a palette that if you assign colors will give you exactly what you see.
- Add a white border to your black bar to make it appear to be a thin line.
Hi Luke,
I completed most part of the wednesday workout challenge except for the line joining the min sales to the max sales for each sub-category. I tried creating it using the reference band with no success.
Could you please help me with some tips.
Thanks!
Try using a line instead of a reference line.
Thanks so much!
This my try of replicating the visual:
https://public.tableau.com/profile/varun7577#!/vizhome/RegionalSalesAcrosstheProductHierarchy-WOW6/WOW-6
Thank you so much Luke for helping people like us to get better at tableau! Looking forward to the next one!
Hi Luke,
here’s my try:
https://public.tableau.com/profile/marcodegola#!/vizhome/WorkoutWednesday2018/2018w06-ww?publish=yes
It seems to me you people undestimate us 🙂
Are the solutions for these posted somewhere? I know this one is old but I’ve been working through them to help me learn. I can do everything except the line connecting the min/max points. I feel like I’m missing something obvious.
We’re hoping to post them for every week. You can always download the workbooks. Most calculations have labels that are step-by-step.
Hi Luke,
Thanks for the post! Here is my late solution:
https://public.tableau.com/profile/sisi.yu#!/vizhome/VizRegionalSalesAcrosstheProductHierarchy/Dashboard1
I spent a little bit time on max/min sales since I used gantt chart, but I noticed Marco’s solution was far much easier…
Hi guys,
I’m just starting to learn Tableau. Could anyone please share the link to the solution video/workbooks?
I couldn’t find how to make those trendlines from lowest to highest.
Looking forward guys !
https://public.tableau.com/app/profile/william.mcdonald4971/viz/W6_2018/WOW-6?publish=yes
Nice practice of dual axis: https://public.tableau.com/views/WOW2018-Week6-SalesAcrossHeirarchy/SalesAcrossHeirarchy?:language=en-US&:display_count=n&:origin=viz_share_link