I’ve had clients requesting stacked bars in various formats lately, so this challenge is timely.
Stacked bars are used as a way to show part-to-whole relationship while also showing totals. The weakness of stacked bars is similar to that of the dreaded pie chart.
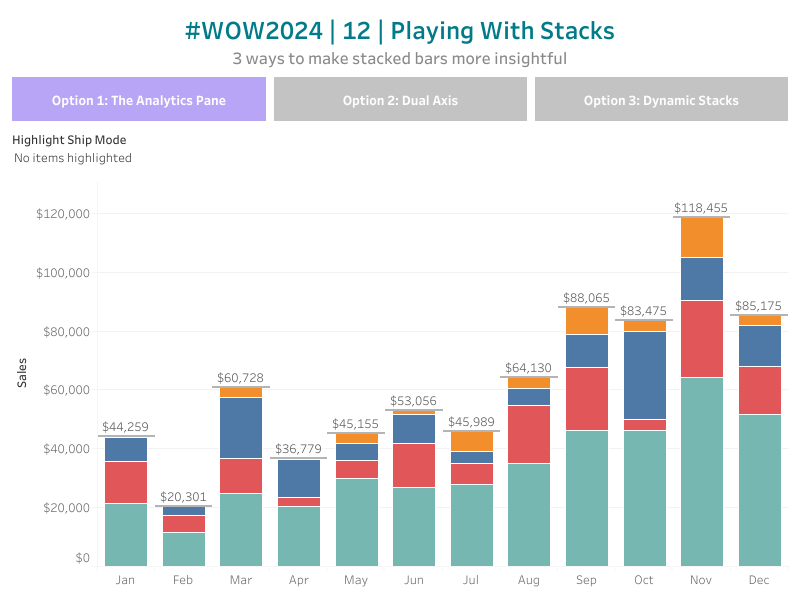
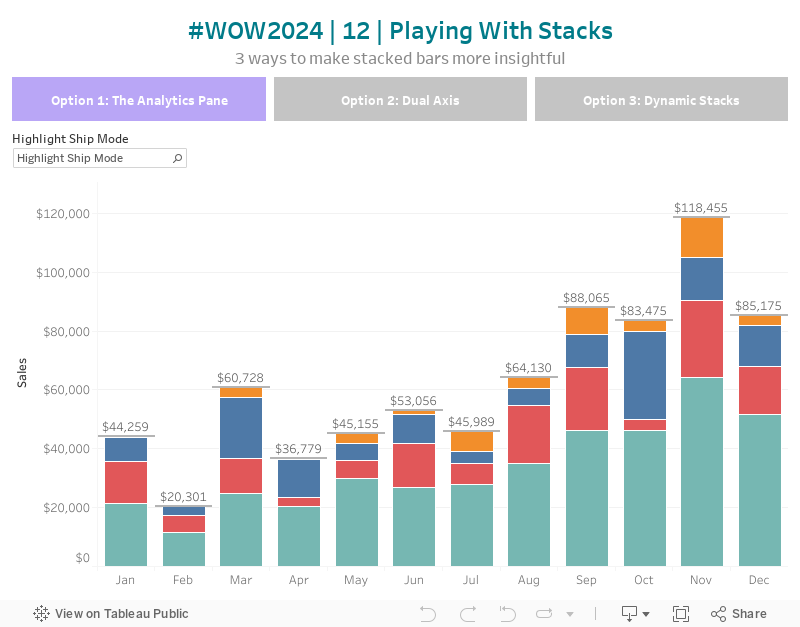
Too many segments become confusing
when trending a stacked column, its easy to see total trend and whichever dimension is at the bottom but difficult for the others because they don’t have a normalized baseline.
So I’ve created 3 solutions for providing easier use and better insights of stacked bars. Can you replicate all three? Feel free to add additional options if you feel like it 🙂
When you publish your solution on Tableau Public make sure to take the time and include a link to the original inspiration. Also include the hashtag #WOW2024 in your description to make it searchable!