
Introduction
This week we are going to look at hospital admission rates. This data source comes from The Medical Stays dashboard on the Tableau Exchange.
This particular challenge is more focused on working with time than it is working with medical data. In this challenge you need to group time into 15 minute increments throughout the day.
Requirements
- Dashboard Size: 1000px by 400 px
- 1 of Sheet
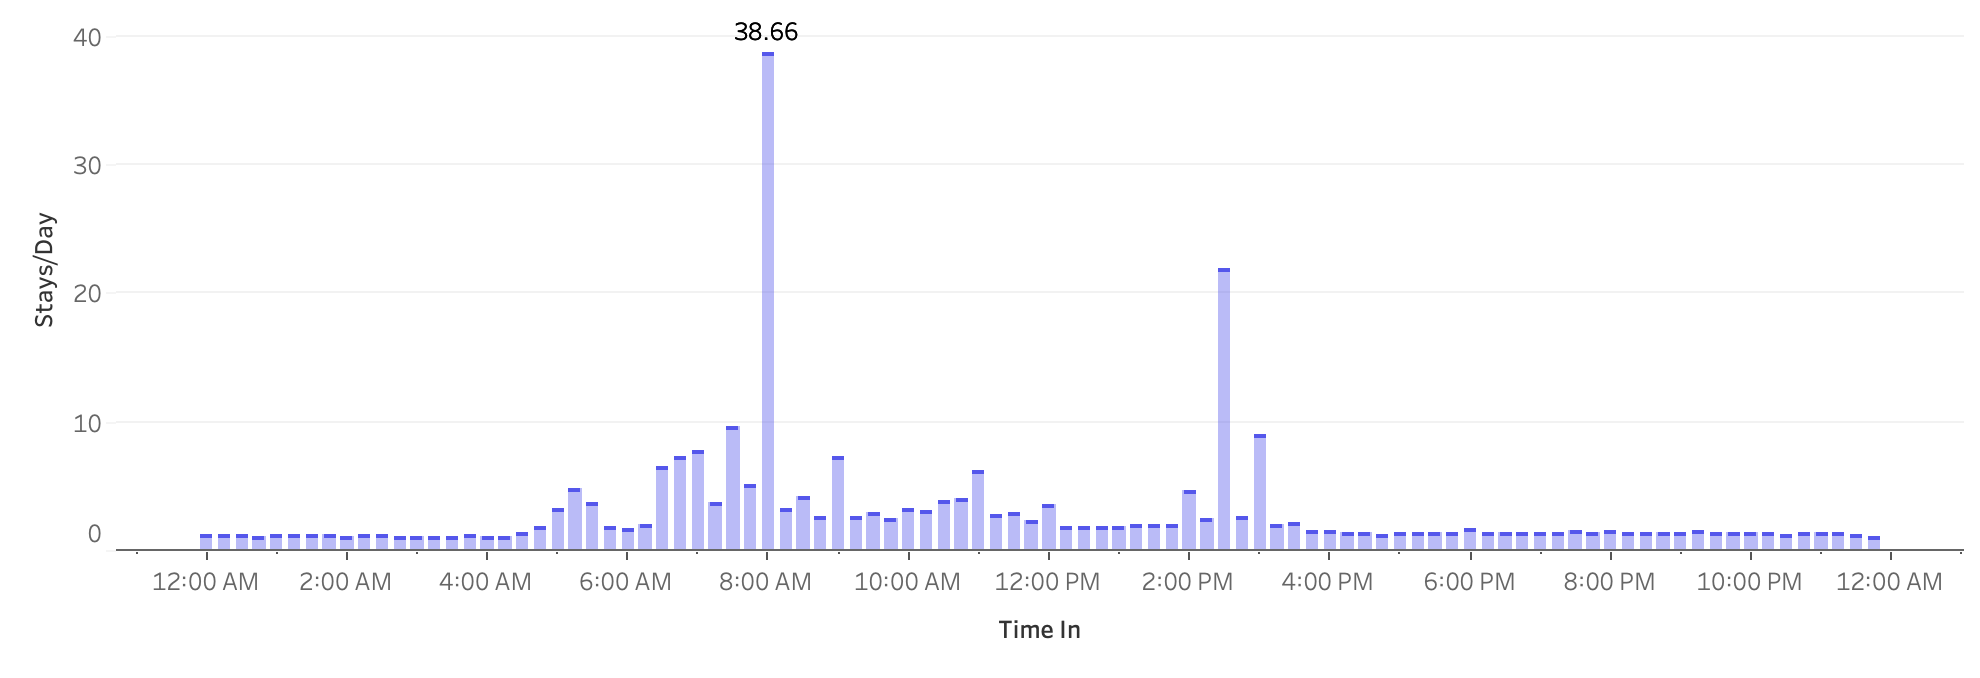
- Calculate the number of stays per admission date by 15 minute increments of the day based on admission date
- Match the formatting of the “bar” chart (#5557EB, #8A8BF1)
- Filter to only Outpatient stay type
- Filter to 2017-Aug-30 or earlier
Dataset
This week uses the data from the Medical Stays dashboard on the Tableau Exchange. Download the workbook, delete all the sheets, and start building.
Attribute
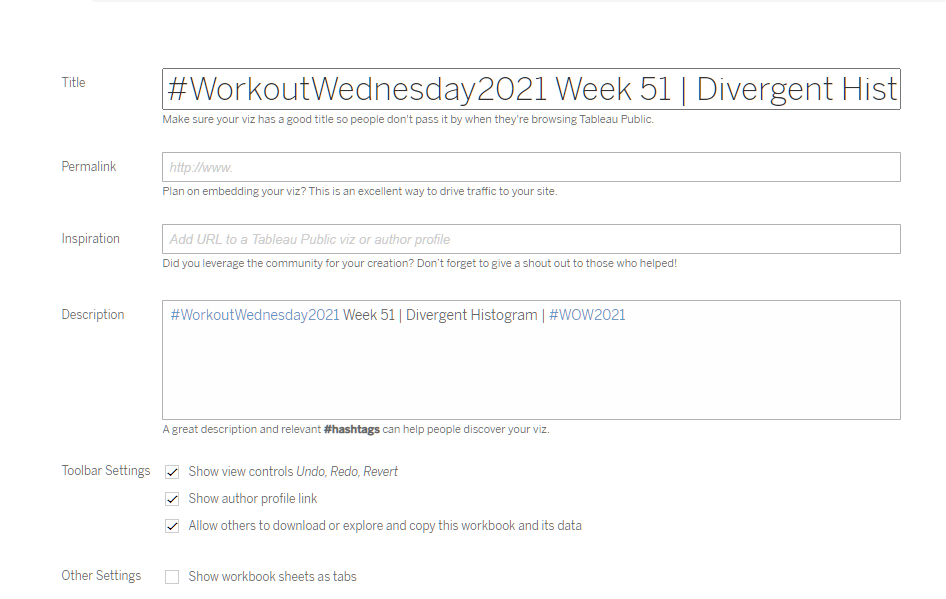
When you publish your solution on Tableau Public make sure to take the time and include a link to the original inspiration. Also include the hashtag #WOW2022 in your description to make it searchable!
Share
After you finish your workout, share on Twitter using the hashtag #WOW2021 and tag @LukeStanke, @_Lorna_Brown, @_hughej, @YetterDataViz and @HipsterVizNinja