Introduction
Hi everybody. It’s now my turn to set my first challenge as part of the official #WOW crew – eeek!. For those of you who don’t know me, I’ve been completing these challenges since the program was launched in 2017, and I blog solution guides on my personal blog at https://donnacoles.home.blog/. I’ve been approached to join the team before, but it just wasn’t quite the right time, but now it is! I’m excited to share my ideas with you all, and hope you learn something new along the way.
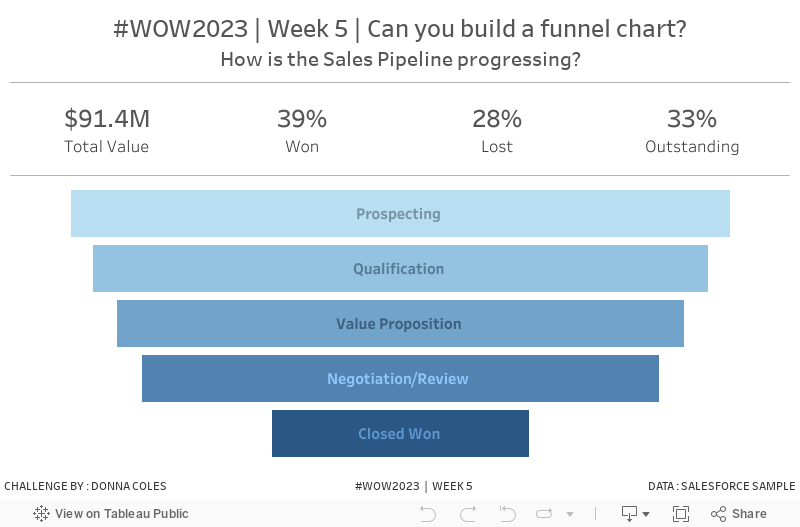
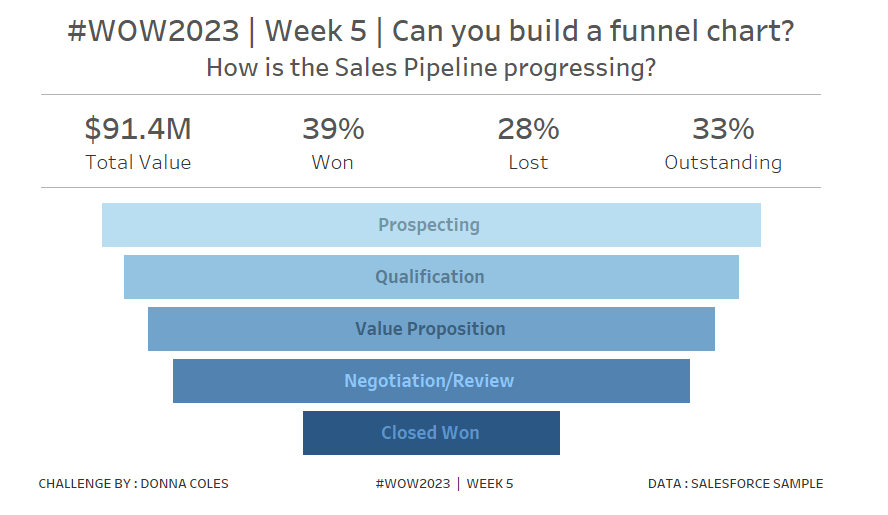
This month we’re focusing on alternative chart types, and to kick things off I’d like you to recreate this funnel chart.
A funnel chart helps visualise a process that has sequential, connected stages in which values typically decrease. At a glance, the shape of the funnel conveys the health of the process you’re tracking.
Requirements
- Dashboard Size: 800 x 500px
- 2 sheets
- The data provided contains 1 row per Sales Opportunity with its value and current stage in the process.
- The Stage No reflects the order of the stage in the process, with 1 (Prospecting) being the first. Either 5 (Closed Won) or 6 (Closed Lost) is the last stage.
- For the purposes of this exercise, you should assume
- any Sales Opportunity that is not Closed will have passed through every preceding stage.
- any Sales Opportunity at stage Closed Won (Stage No 5) will have passed through all preceding stages (stages 1-4)
- any Sales Opportunity at stage Closed Lost (Stage No 6) will also have passed though stages 1-4, but not stage 5.
- Create KPIs indicating total value of all the Sales Opportunities, the % value that has been won, the % value that has been lost and the % value outstanding
- Create a funnel chart where each ‘bar’ represents the % amount that has passed through that stage of the pipeline.
- Try to ensure each ‘bar’ can be selected as a single object
- Match tooltips and formatting
Dataset
This week uses an adapted Sales Opportunity data set. You can access it here.
Attribute
When you publish your solution on Tableau Public make sure to take the time and include a link to the original inspiration. Also include the hashtag #WOW2023 in your description to make it searchable!

Share
After you finish your workout, share on Twitter and/or LinkedIn using the hashtag #WOW2023 #Tableau and tag @WorkoutWednsday
Solution
Interactive