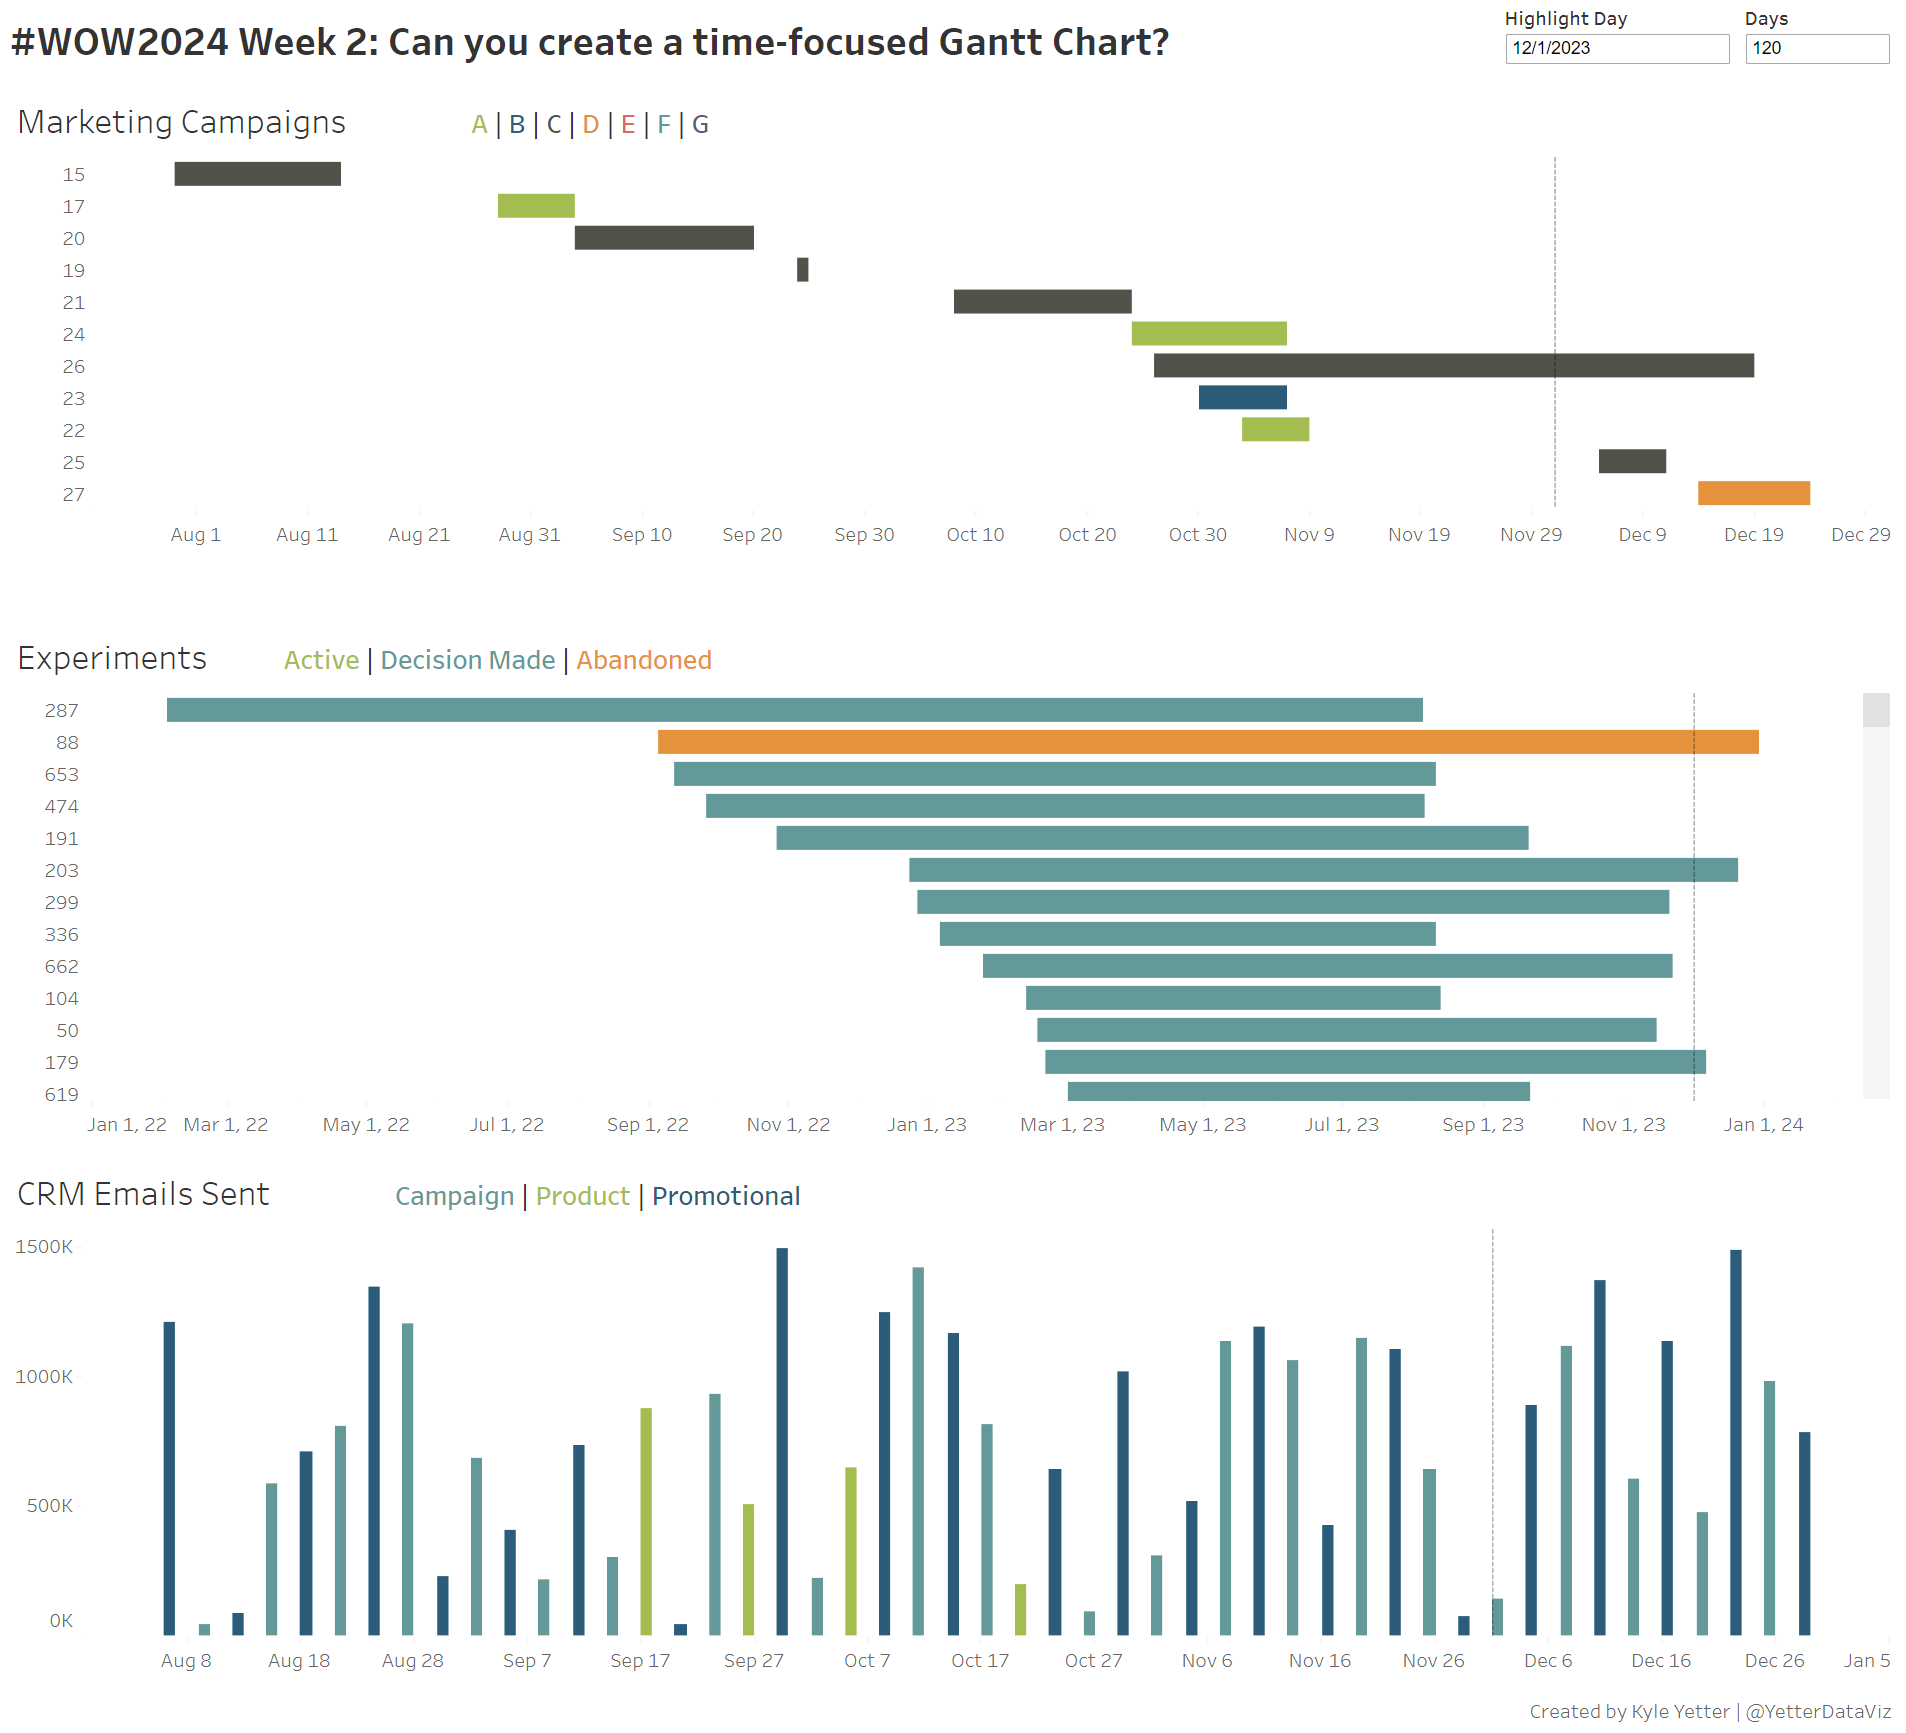
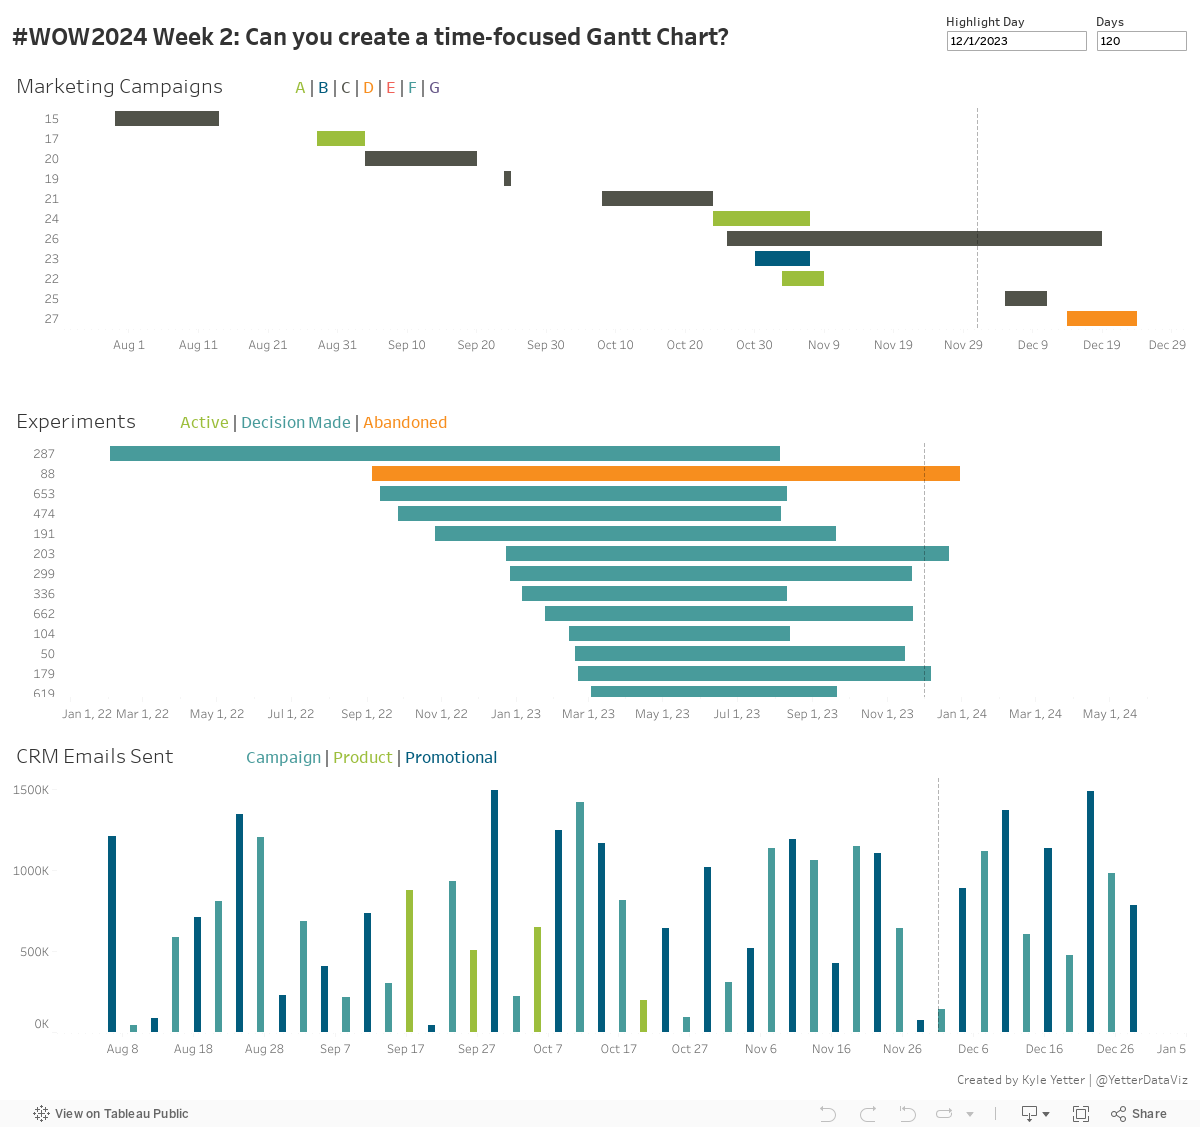
This week’s challenge is another from recent experience. As we have spikes or drops with various metrics, we found that we often asked the same questions…What marketing campaigns were happening at that time? Did we send any big email campaigns around then? Did we launch a new product feature or experiment? With all these questions in mind, we set to work to pull together data from all of the disparate data sources into one central place. But with such varied sources, we need to be able to look at a specific time window so we’re not scrolling through a year’s worth of items. This challenge combines the elements of visualizing the activity and focusing in on the specific time window.
Create a Gantt Chart showing Marketing campaigns and when they run, sorted by Start Date, colored by Category
Create a Gantt Chart showing experiments with their status and length, again ordered by Start Date. (Beware the experiments that don’t have an end date, you’ll need to address that)
Create a bar graph of CRM emails
Each chart should have a reference line based on a highlight date on the dashboard
Each chart should be filtered to only include items that were running within the selected days before/after the highlight date
Dataset
This week uses some fake data sets I created. You can find them here on Data.World
Attribute
When you publish your solution on Tableau Public make sure to take the time and include a link to the original inspiration. Also include the hashtag #WOW2024 in your description to make it searchable!