Introduction
Well here we are! My first week as an “official” contributor of #WorkoutWednesday! I’m so excited to share my three (3) challenges with you so let’s get to it with the first one. In my day to day life at Cerner, I build analytics that cast a wide net of user personas with all types of different questions of the same data. And as such, the overwhelming majority of my dashboards have custom date filters where each user can go in and select their own date range that they need and every one’s happy. However, I’ve always thought it would be nice to provide “quick” filter options while still allowing for custom date ranges. If you’ve worked with dates in Tableau you know there’s no native way to dynamically flip between relative and custom dates.
And that’s what this challenge will focus on. Giving your users the experience of selecting between relative and custom date ranges.
Requirements
- Dashboard Size: 1100px by 800 px
- # of Sheets – up to you
- Create a Row of KPI BANs – #049DA5
- Total Sales
- Profit Ratio
- Total Profit
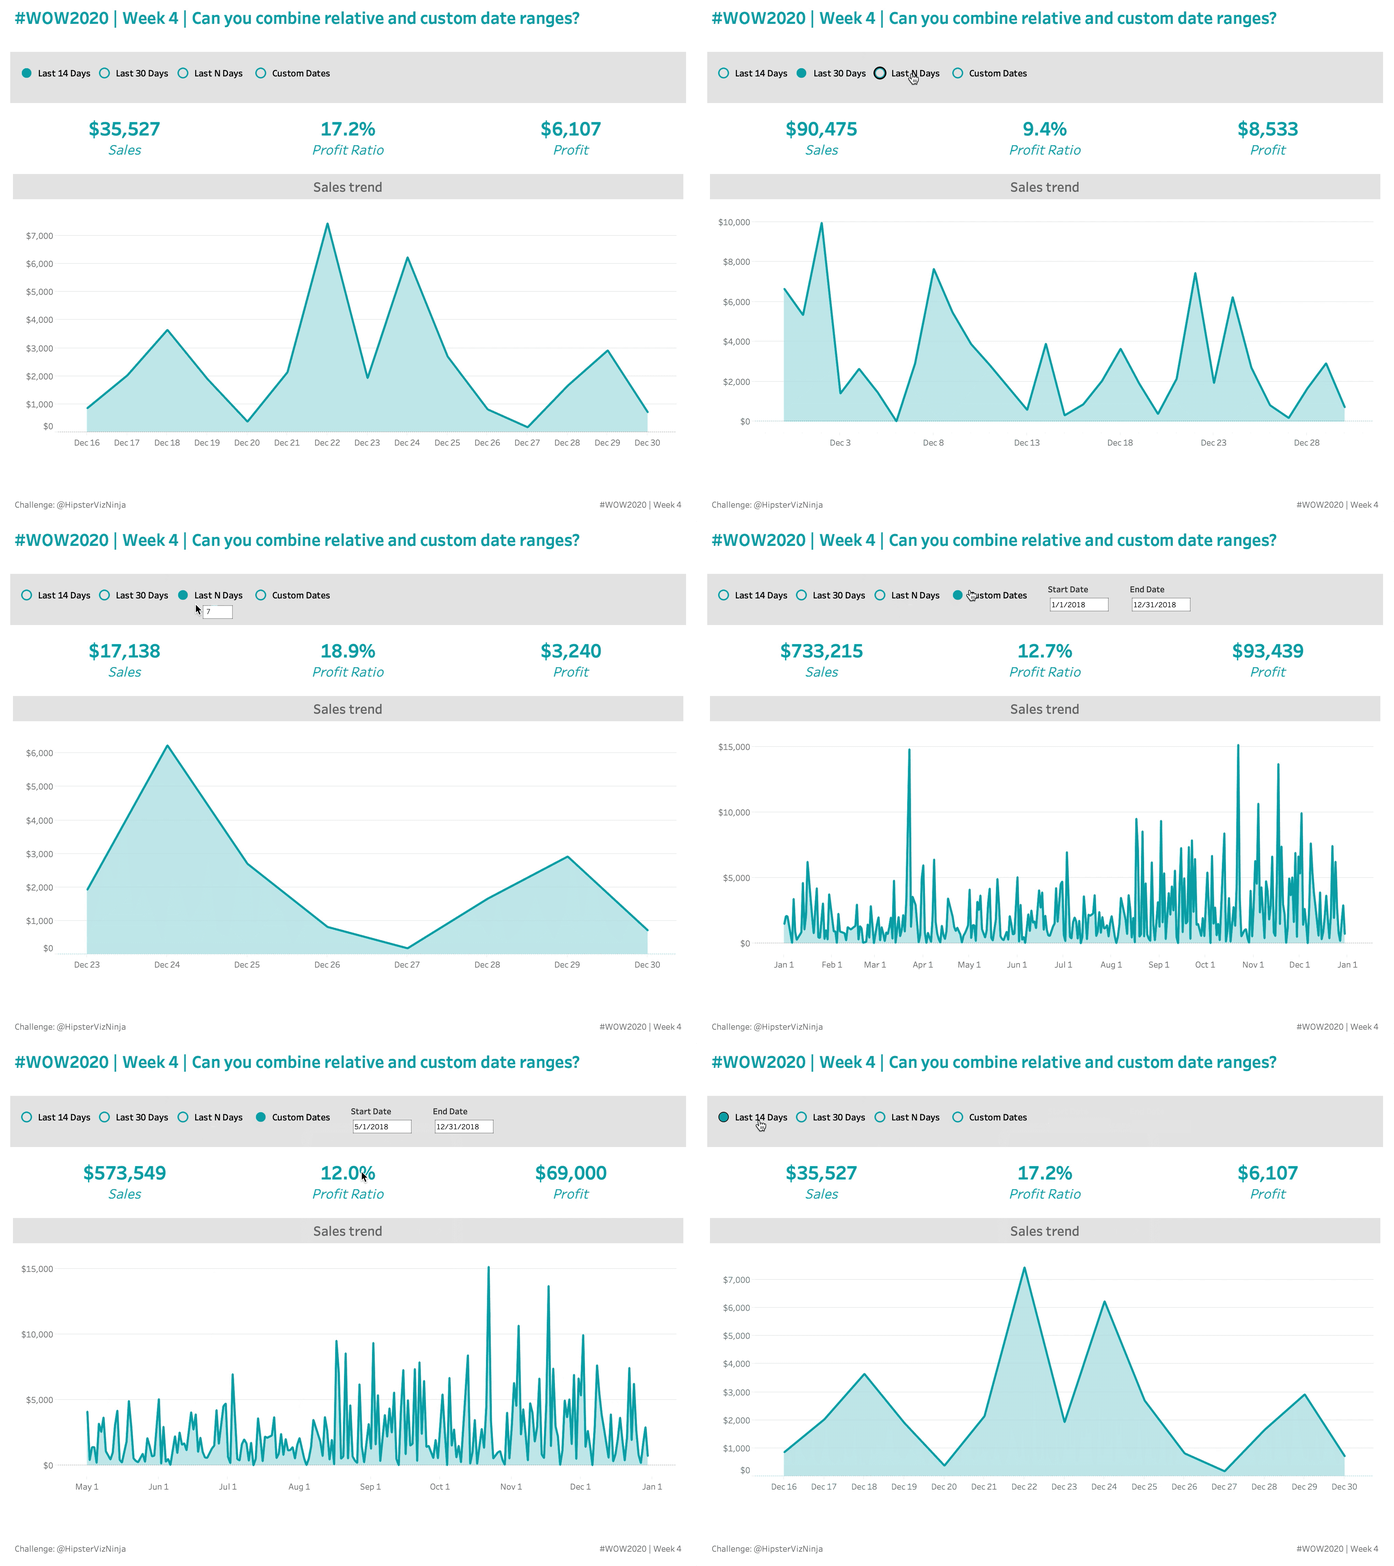
- Create an outlined area chart showing Sales by day
- #049DA5
- Add in a dynamic button to select the date range
- Last 14 Days
- Last 30 Days
- Last n Days
- When selected the user should be able to type an integer
- When not selected, the integer box should not be visible
- Custom Date Range
- When selected, the user should be able to select a start date and an end date
- When not selected, the date selectors should not be visible
- The “Last …” selections should be anchored to the max date of the dataset
- Match formatting and tooltips
Dataset
This week uses the superstore dataset for Tableau 2019.4. You can get it here at data.world
Attribute
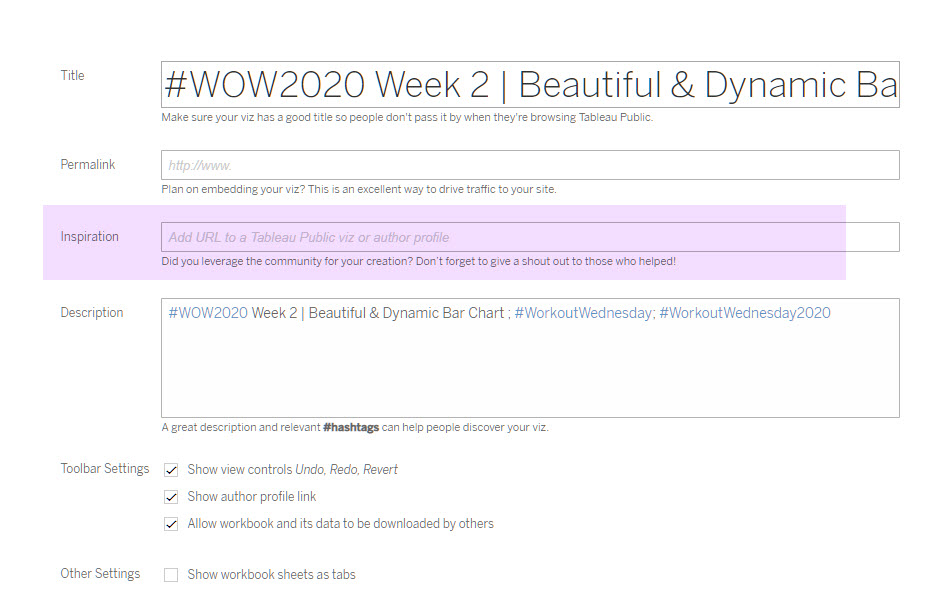
When you publish your solution on Tableau Public make sure to take the time and include a link to the original inspiration. Also include the hashtag #WOW2020 in your description to make it searchable!

Share
After you finish your workout, share on Twitter using the hashtag #WOW2020 and tag @AnnUJackson, @LukeStanke, @lorna_eden, and @HipsterVizNinja

I think I prefer the longer solutions where the contributor builds the visualisation from scratch (like the previous solutions this year). As someone who is not an advanced user, it really helps me understand how and why elements are being created as opposed to just being shown the pieces that were used in the solution.
Something I would like to understand more was the anchor date parameter. You mentioned that in your line the today function isnt so useful. Is that to say you like to be able to set your ‘today’ to whatever is needed but potentially need to manually update this parameter as time progresses?
Thank you for your video
Hi Ryan,
Regarding the anchor date. There were a couple of reasons I went with the parameter. First and foremost, in conditional sets, the logical statement can only refer to the database column you are building a set for. It will not allow for other columns to be used. Secondly yes, I work in health care and it can take upwards of the 3 months for all medical claims to come through so in my world, “most recent” is equal to 3 months ago. So the way I set this challenge up, I could easily do date math in a calculated field and then reference that field in a parameter. And as soon as dynamic parameters comes out (SOON!) that parameter value will auto refresh.
Thanks for the feedback and the question!
This was an interesting one!
Had to learn a new technique in oder to show parameters dynamically
here’s my shot: http://bit.ly/2020w04
Thanks. It is not a step by step solution video, while I made it by the clues you provided. Although it was took more time to finish, I feel more achieved when I was done. Oh yeah ! The dynamic parameters is very interesting.