Introduction
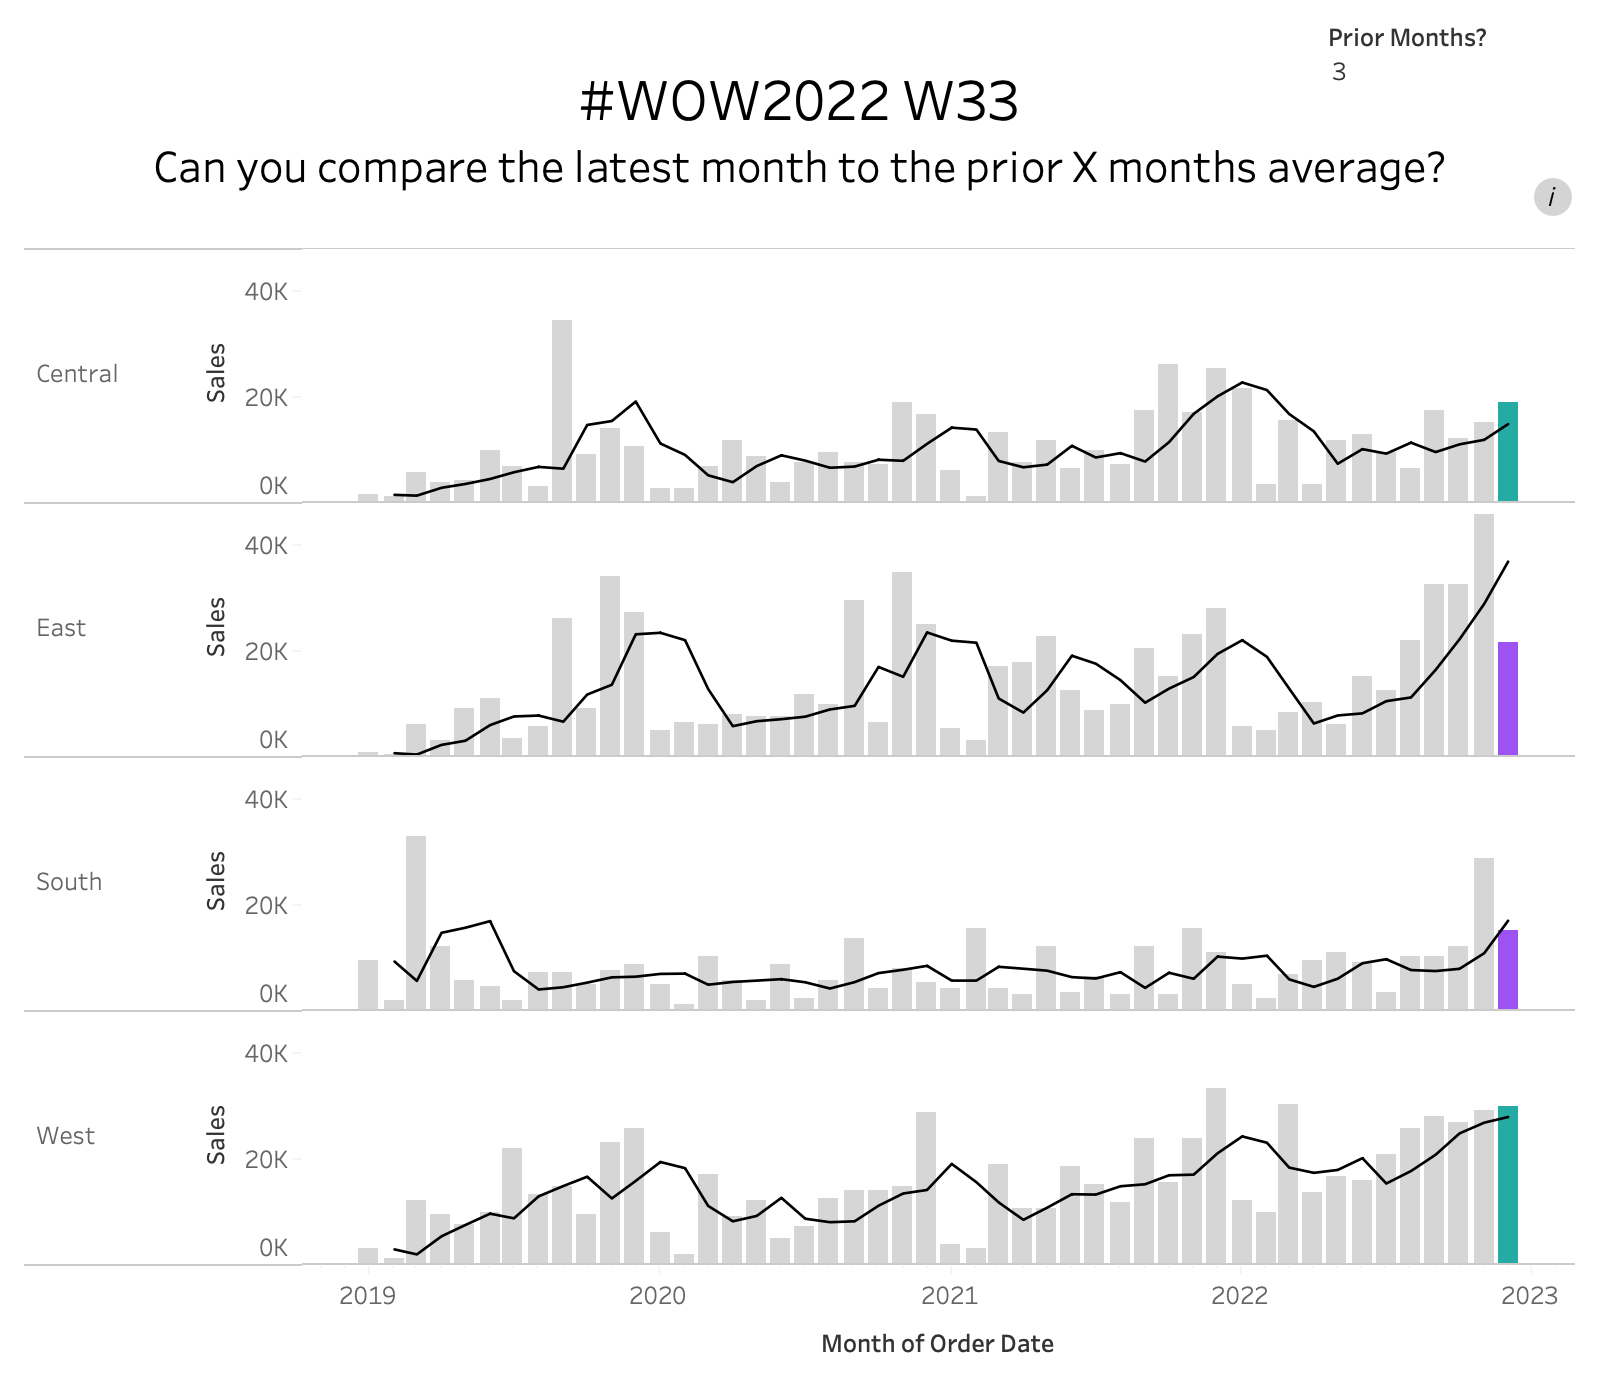
When looking through the challenge insights I realised we haven’t had many of the fundamental LOD style Workouts for a while. So this week we take a look at how does the latest month compare to the prior X months average?
Requirements
- Dashboard Size: 800 x 700px
- 2 sheets (only because of info icon)
- Create calculations that pulls back the latest months sales
- Create calculations that pulls the prior X months sales and then average those (this should not include latest month)
- Add in an X month moving average line to show the values across the time period
Dataset
This week uses Sample Superstore from 2022.2. You can get it here.
Attribute
When you publish your solution on Tableau Public make sure to take the time and include a link to the original inspiration. Also include the hashtag #WOW2022 in your description to make it searchable!

Share
After you finish your workout, share on Twitter using the hashtag #WOW2022 and tag @LukeStanke, @_Lorna_Brown, @HipsterVizNinja, @_hughej, and @YetterDataViz
