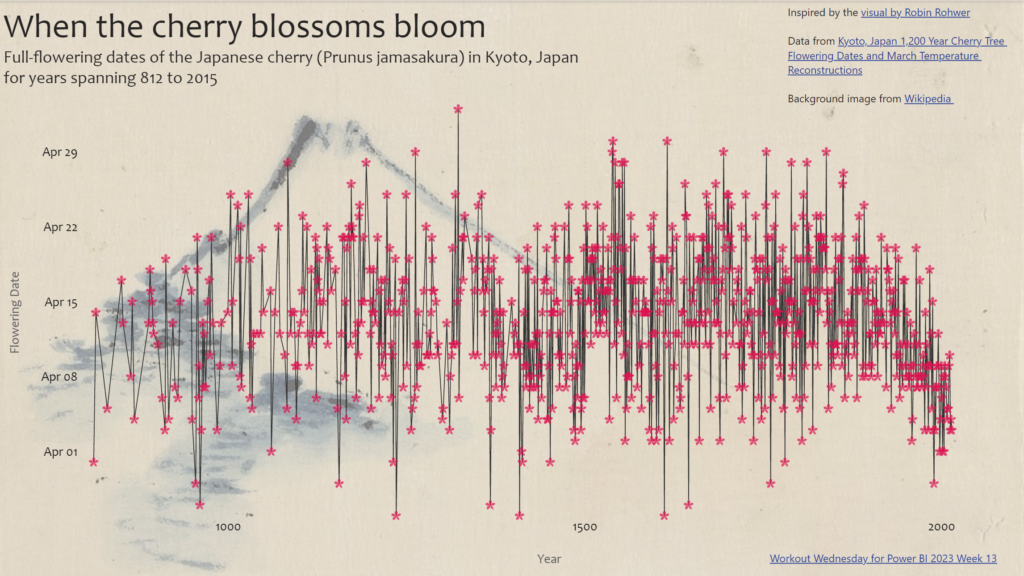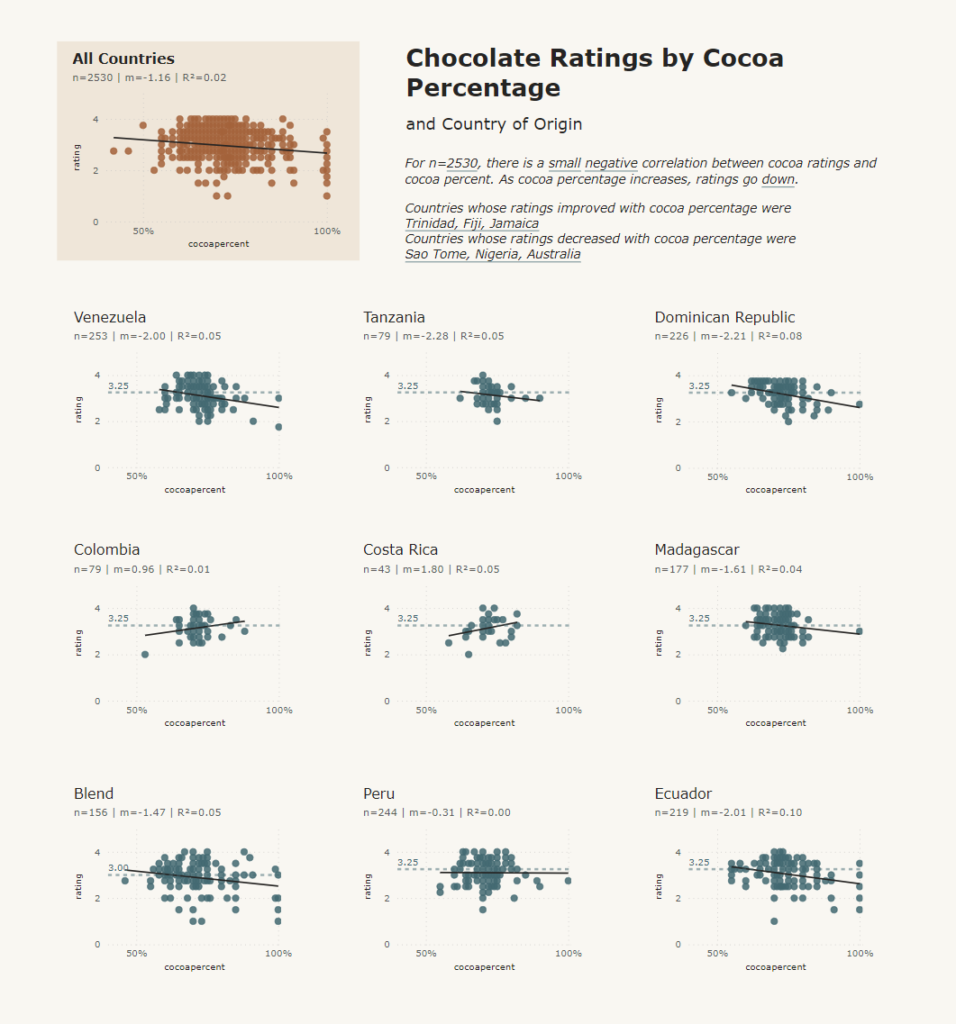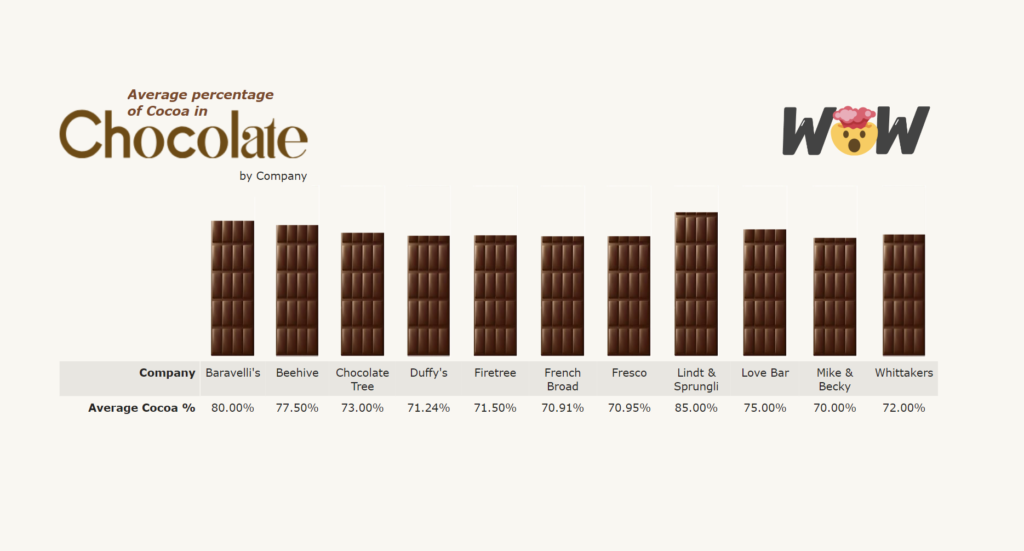
2023 Week 18 | Power BI: SVG Clip Path
Introduction This week’s challenge is a little SVG fun. Recent Power BI Desktop changes have allowed even further width and height adjustments for images in matrix visuals. So we will be extending this by making a bar chart of chocolate bars. Requirements Power Query Obtain the dataset from 2023-week-11 challenge or; Obtain the dataset from …