Tableau

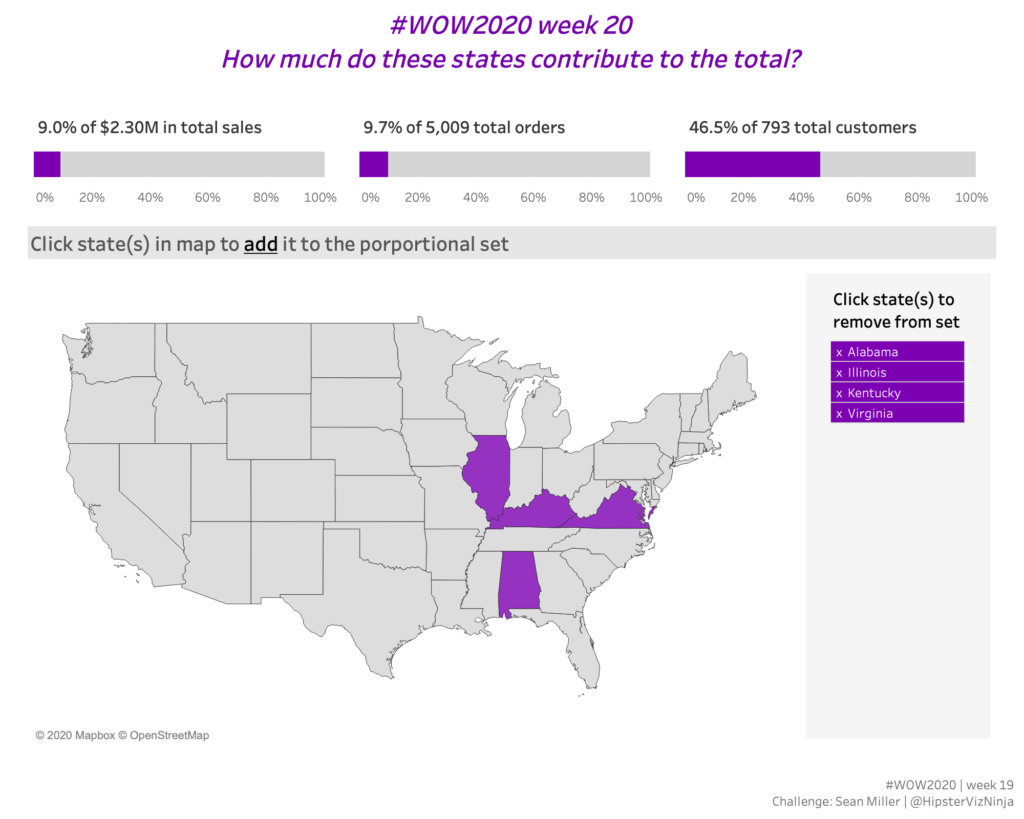
2019 Week 20: Can you show the top and bottom states for total orders

This week Ann and I are doing a live Workout Wednesday for the San Fransisco Bay Area Tableau User Group, so I tried to make sure this challenge can be done in 30 minutes. Challenge Click image to view on Tableau Public Requirements Format: 750px by 850px Create a bar-on-bar chart that shows: A top …

2019 Week 20: Can you show the top and bottom states for total orders Read More

2019 Week 15: Tableau Stock Market – How does the stock compare to the overall average or a date selected value?

Sets, Glorious Sets. Was what I tweeted out earlier this week, as I was finishing off my IronViz entry for Europe! Sets and set actions are super powerful and there are so many use cases. This week we take a look at the Tableau Stock market, using the almighty SET ACTIONS, and obviously it includes …

2019 Week 15: Tableau Stock Market – How does the stock compare to the overall average or a date selected value? Read More

2019 Week 14: Can you build a line chart with dynamic highlight and comparison?

Care to join me on an adventure to the dark side?  While it’s true I might not yet have the Sith skills of Curtis when it comes to the dark side, I’ve decided to tip the balance of the force toward the dark this week. The workout this week combines a few concepts inspired by …

2019 Week 14: Can you build a line chart with dynamic highlight and comparison? Read More

2019 Week 13: Can you create a dynamic view of historical DATA prices?

This week were taking a look at Tableau Stock prices using candlestick charts. So whats different about this? The dates aggregate at differet levels depending on the number of candlesticks! This challenge is not easy so there are 2 achievement levels. You can make this chart using either a gantt chart or by unioning the …

2019 Week 13: Can you create a dynamic view of historical DATA prices? Read More

Scroll to Top