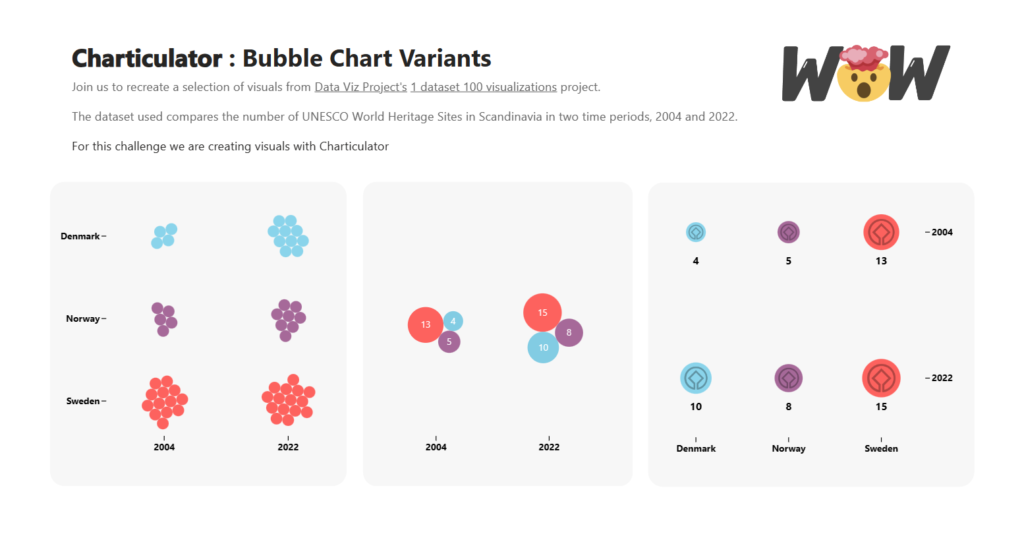
2023 Week 25 | Power BI: Bubble Chart Variants with Charticulator
Introduction This week we are continuing our viz efforts inspired by the 1 dataset 100 visualizations project, presented by the Data Viz Project. Last week, Meagan challenged us to create as many visuals as possible using the Deneb custom visual available in Power BI AppSource. The week before, Shannon challenged us to make as many visuals as …
2023 Week 25 | Power BI: Bubble Chart Variants with Charticulator Read More