table calculations

#WOW2022 Week 31: Let’s build a KPI dashboard

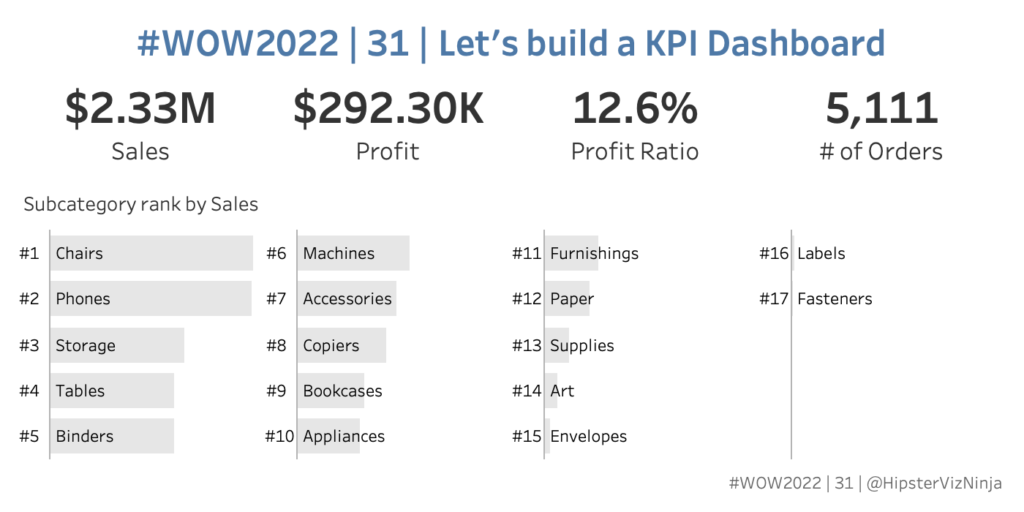
Introduction Who doesn’t love a good KPI dashbaord? This one is fairly simple and straightforward. Let’s look at four simple metrics and see how each subcategory ranks within a selected metric. With this challenge – MIND THE NUMBER FORMATTING 🙂 Click to open in Tableau Public Requirements Dashboard Size: 700 x 350 2 sheets Display …

#WOW2022 Week 31: Let’s build a KPI dashboard Read More

2022 – Week 14: Can you track headcount?

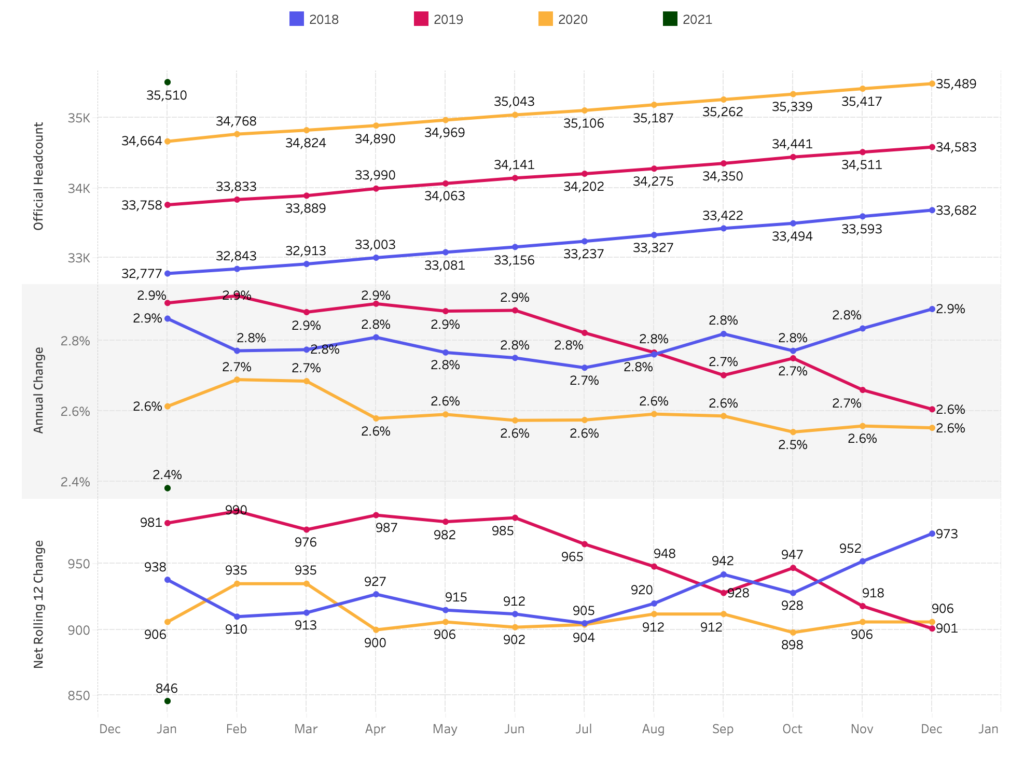
Introduction This week we are looking at HR headcount data. Headcount data can sometimes seem straightforward to work with, but sometimes the reporting rules can be a bit complicated–particularly with large organizations. This week you will attempt to measure the headcount of a large organization using data from the Real World Fake Data project by …

2022 – Week 14: Can you track headcount? Read More

WOW2022 Week 2: Can you build a weekly Year-over-Year line chart?

Introduction I’m excited to join the Workout Wednesday coaching team this year! For my first challenge, I’m pulling from some recent work experience. Our leadership team wanted to see weekly performance for the week ending Sunday, with the current and prior 2 years in the chart. We also needed to include the YoY% change, and …

WOW2022 Week 2: Can you build a weekly Year-over-Year line chart? Read More

2021 Week 34: How Many Consecutive Starts?

Introduction Today I’m excited to share a challenge in collaboration with Dr. Eric Eager at PFF. PFF analyzes data about professional football (in this case the American version). In this game, there are many players, but the most critical player supports a role called the Quarterback. In this challenge you’ll count the number of consecutive …

2021 Week 34: How Many Consecutive Starts? Read More

2021 Week 33 | Tableau: Can you create a moving average chart with a focus on selected subcategories?

Introduction After the results of the community survey, the top ranked feature was Table Calculations, so guess what? Let’s do some Table Calculations! Click to open in Tableau Public Requirements Dashboard 600 x 600 ONE SHEET Table Calcs ONLY! Create a parameter controlled moving average by month for sales. Create a way to multi-select subcategories …

2021 Week 33 | Tableau: Can you create a moving average chart with a focus on selected subcategories? Read More

Scroll to Top