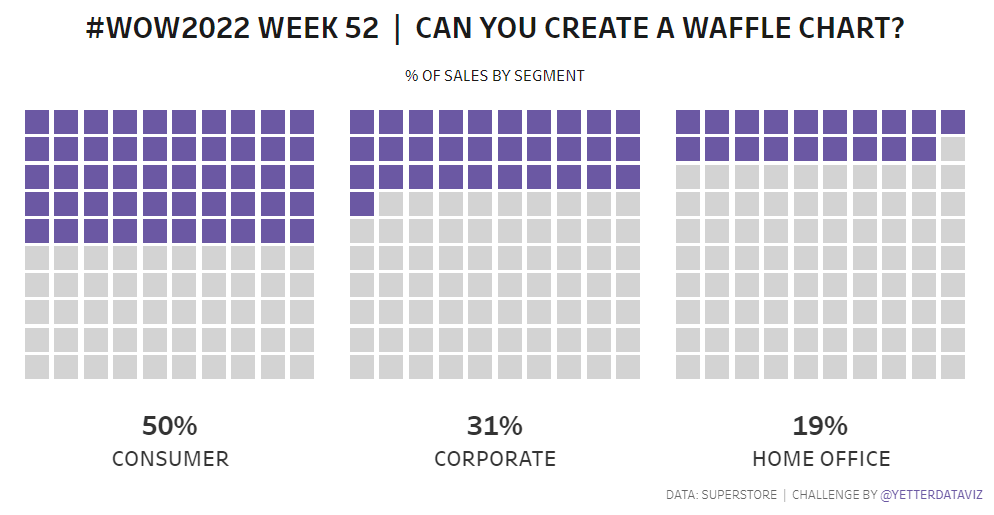
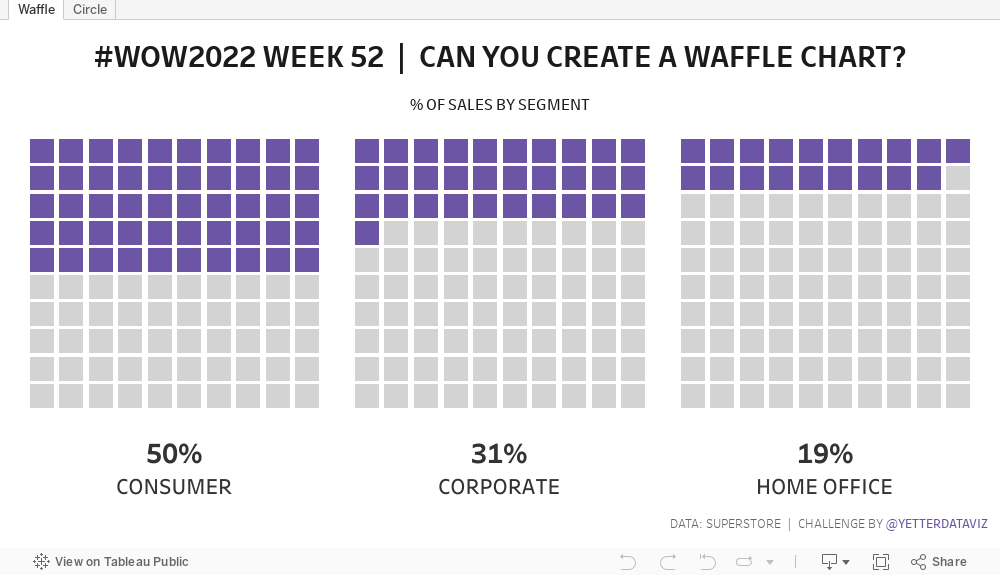
What a year 2022 has been! For the last challenge of 2022 we’ll build some waffle charts showing % of sales by segment. Even though I knew the general principle of waffle charts, it was some good practice for me making this one. Hopefully it’ll be some helpful practice for you all as well.
Create a waffle chart that displays % of Sales by Segment (you can make it with squares or circles)
Create BANs showing % for each segment
No tooltips
Dataset
This week uses Superstore data set. You can find it here on Data.World
Attribute
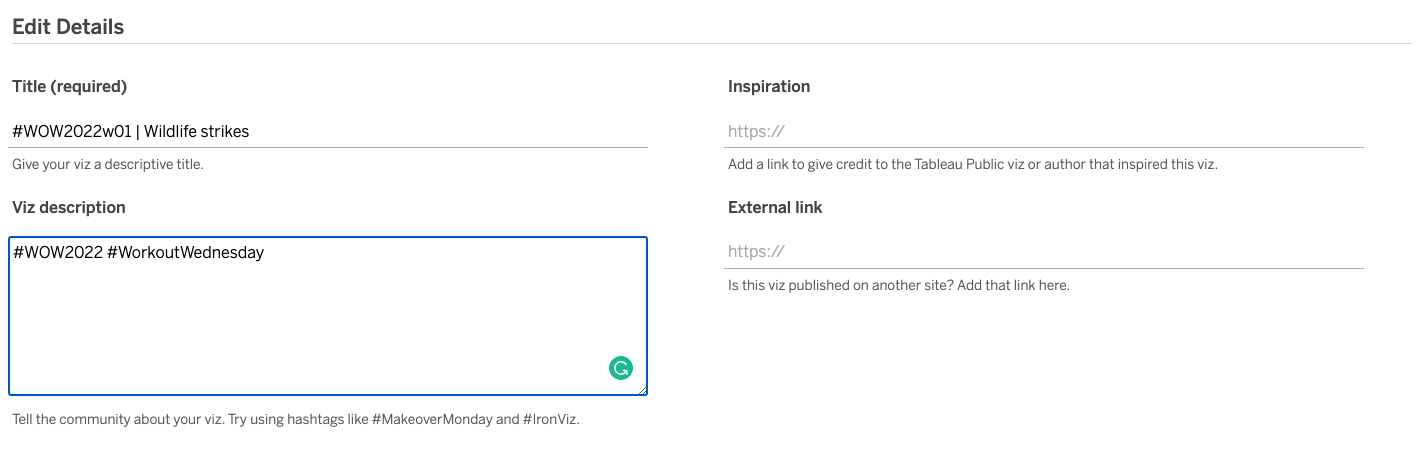
When you publish your solution on Tableau Public make sure to take the time and include a link to the original inspiration. Also include the hashtag #WOW2022 in your description to make it searchable!