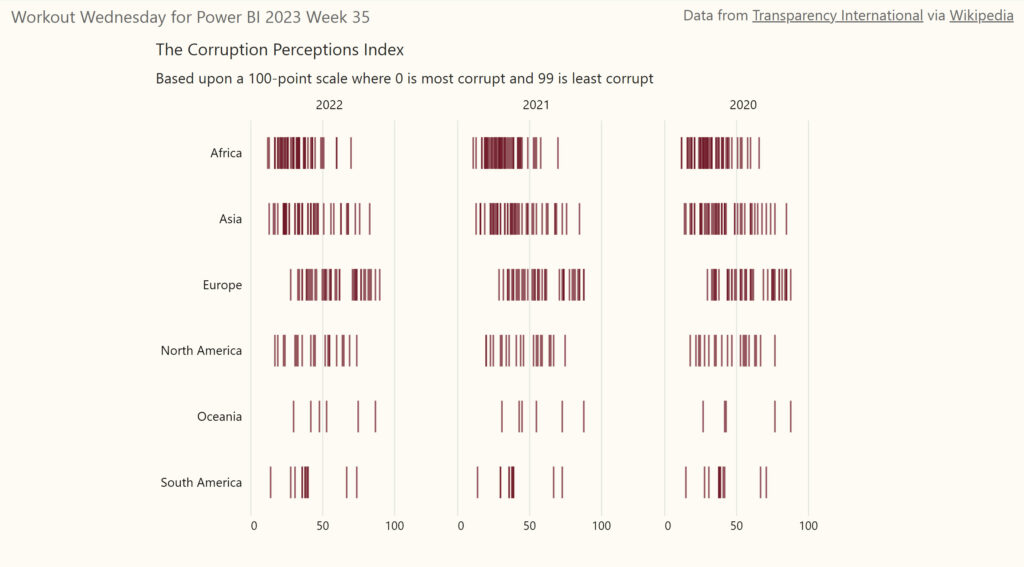
2023 Week 35 | Power BI: Create a Faceted Instance Chart
Introduction Sometimes it can be useful to show all data points instead of aggregating them. That is where an instance chart, also called a strip plot or a barcode plot, can be useful. A strip plot is like a single-axis scatter plot. The symbol or shape used in the instance chart can vary, but it’s …
2023 Week 35 | Power BI: Create a Faceted Instance Chart Read More