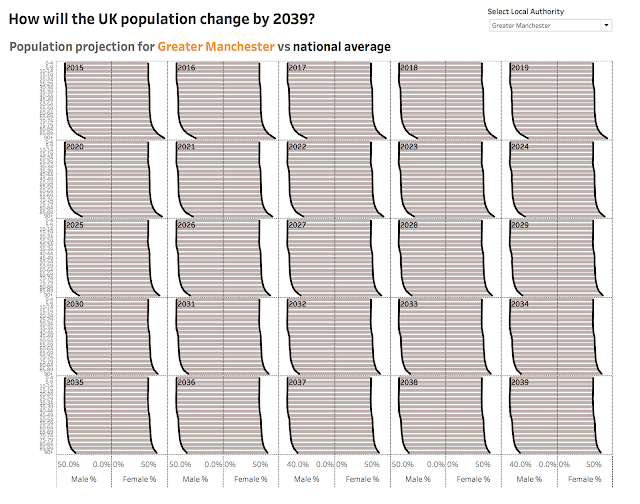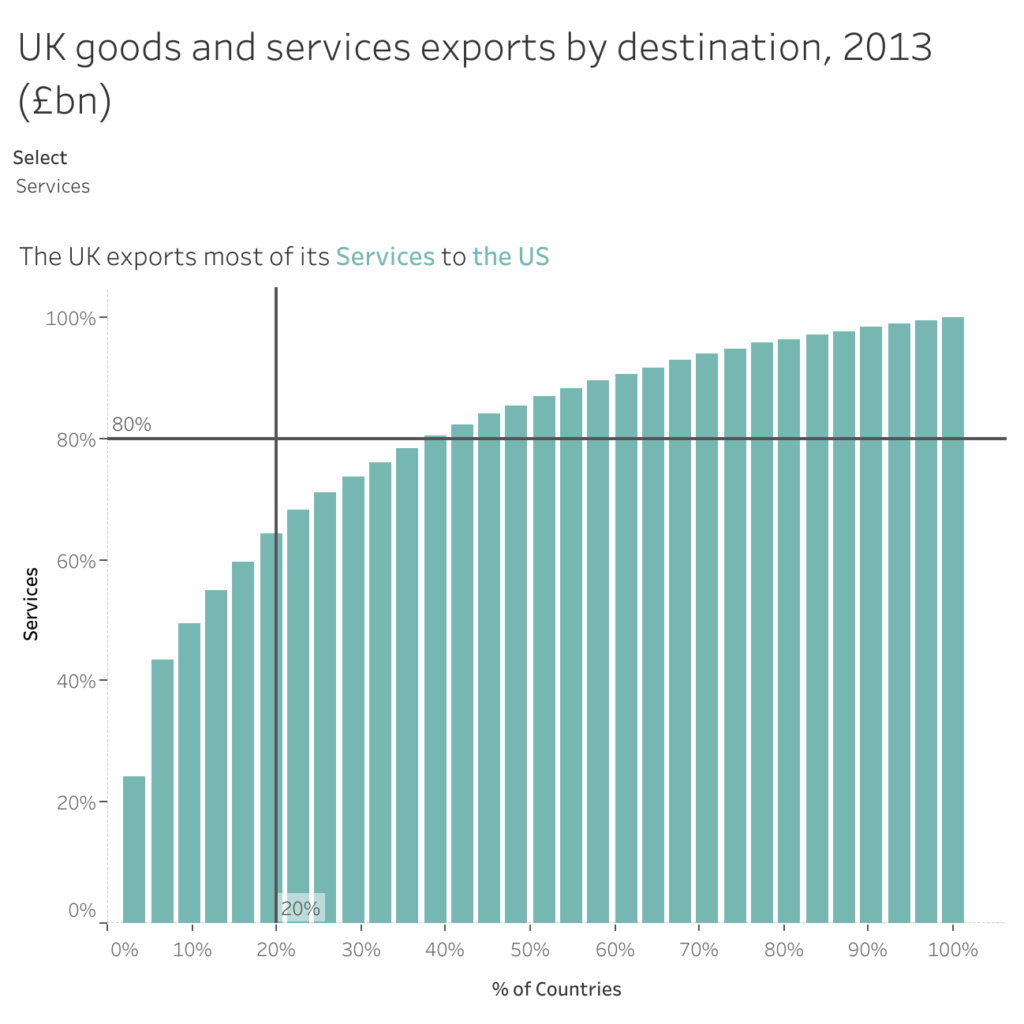
#WOW2017 | 14 | UK Exports
Introduction EDITOR’S NOTE: This challenge was originally published on Emma Whyte’s Tableau blog which no longer exists. This challenge is republished here with the author’s permissions I recently saw this post from Ben Jones on simple ways of transforming tables of data in to multiple vizzes. The blog itself is a great insight in to the thought processes …