WOW2017 | 10 | UK Home Prices

Introduction

EDITOR’S NOTE: This challenge was originally published on Emma Whyte’s Tableau blog which no longer exists. This challenge is republished here with the author’s permissions
 

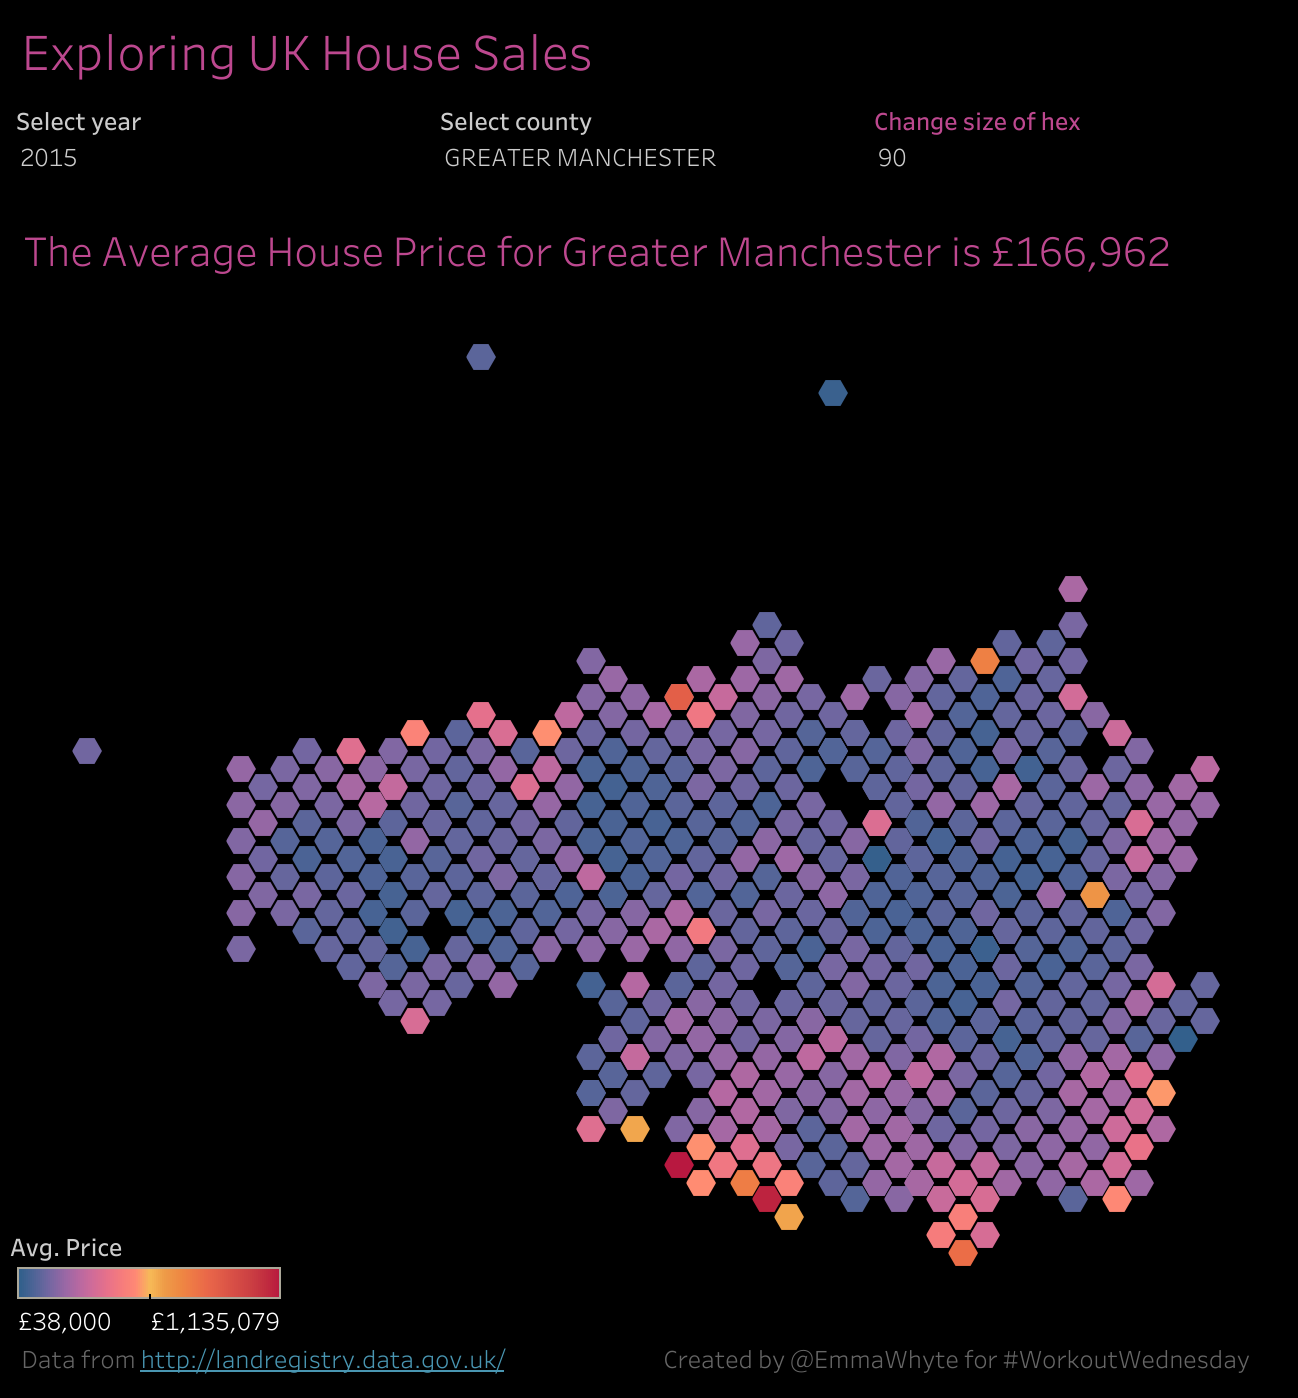
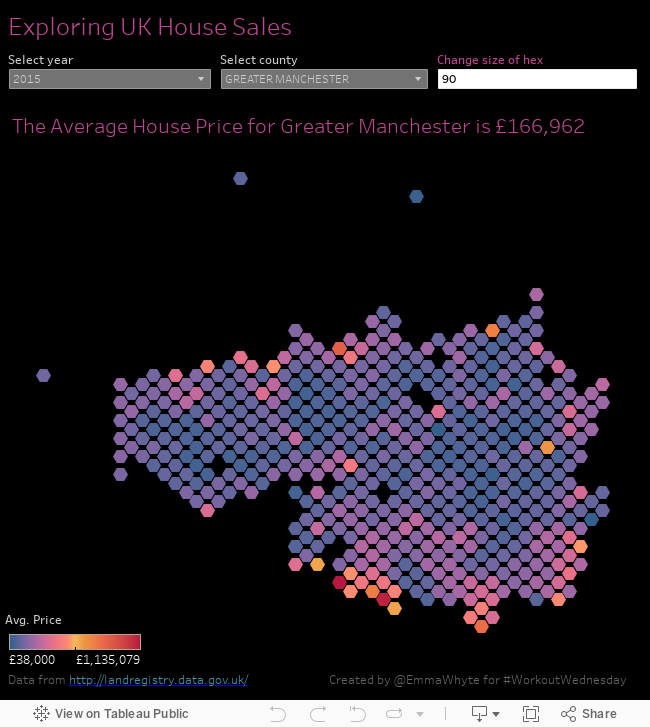
For week 10 of #WorkoutWednesday I’m exploring hexbin maps in Tableau. I’ve not really had the need to create a hexbin map before, and thought I’d use this as a learning opportunity. Plus I thought the data worked well as a hexbin map, rather than a traditional point map.

Case in ‘point’: if using a traditional point map with this data in an area like Greater London where we have many data points, we lose the ability to easily see each point as they start to overlap.

 
Using a hexbin map stops this overlapping as the hexagons tesselate instead.


The only downfall to the hexbin map is that you have to be fairly familiar with the area to understand where the hexbin would lie on a traditional map.

Anyway, on to the challenge. You have to re-create the below viz exactly, here are a few pointers:


Requirements

  • I have already pre-filtered the data to 2015-Nov 2016 and a selected number of counties to create a smaller extract and file size for download
  • Create the hexbin map based on the District 
  • You should be able to change the size of the hexagon using a parameter
  • I’m using the sunrise-sunset diverging colour palette on my hexagons
  • Make sure your tooltips and titles are exactly the same as mine
  • My dashboard is 650 * 700 pixels
The data is from the Land Registry and you can download the .tde here.

Attribute

When you publish your solution on Tableau Public make sure to take the time and include a link to the original inspiration.  Also include the hashtag #WOW2023 in your description to make it searchable!

Share

After you finish your workout, share on Twitter and/or LinkedIn using the hashtag #WOW2023 @Tableau and tag @WorkoutWednsday @EmmaWhyte & @vizwizbi


Solution

Interactive

Scroll to Top