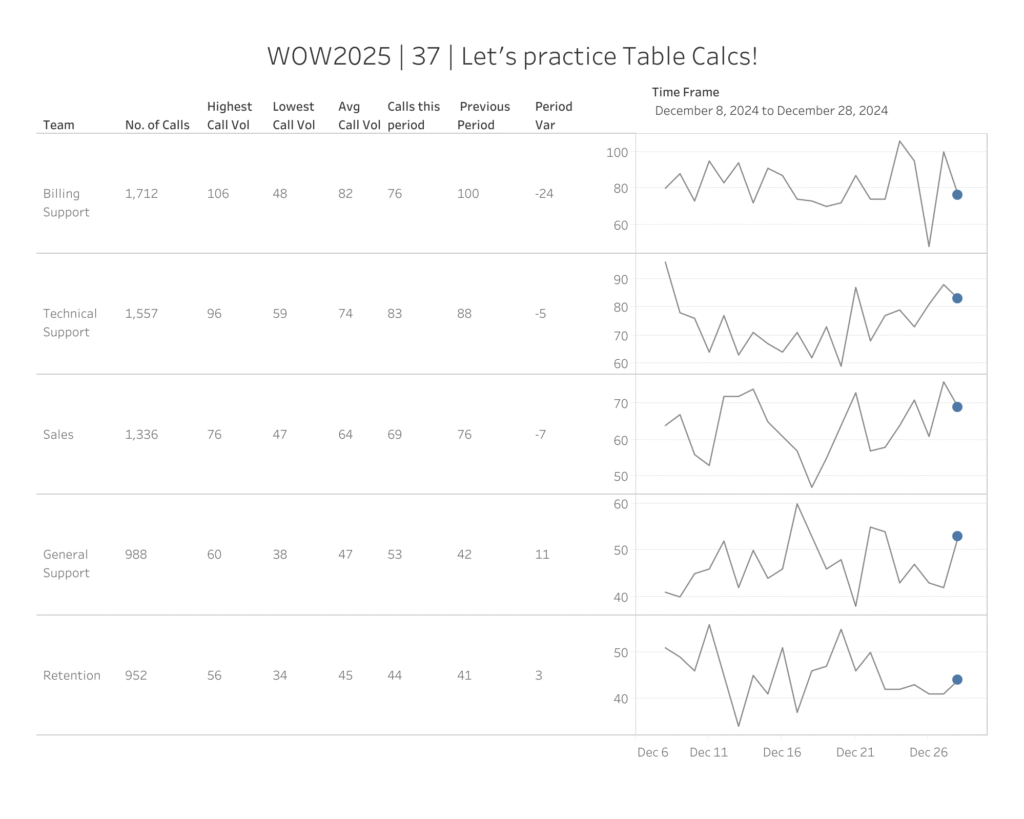
Uncategorized

#WOW2025 | Week 18 | Can you Filter or Drill to Details?

Introduction I’m so excited to be back for another WOW challenge! Fresh off the heels of Tableau Conference, I’m back in dashboard mode. This week I was faced with an interesting use case that I needed to accomplished and after I did, I knew it would make a great challenge. So here we go! So …

#WOW2025 | Week 18 | Can you Filter or Drill to Details? Read More

2024 Week 27 | CRM Analytics: Quasi-Histogram

Introduction Hello again, everyone. One of the things that CRM Analytics misses in its variety of charts is a histogram. A histogram is a chart that displays the frequency (count) of rows within a range of numeric values. For example: you have opportunity records with several amounts (2500,3000,5000.8750.10000, etc). In a histogram, we’d create a …

2024 Week 27 | CRM Analytics: Quasi-Histogram Read More

2024 Week 07 – Column interaction sorting

Introduction It’s already week 7 of our #WorkoutWednesday challenges (whoa, time flies…). In this challenge, I’d like to explore one aspect of the column multi-selection interaction in CRM Analytics: sorting. When we select more than 1 grouping, can we maintain the sorting within the selected groups, regardless of the selection’s order? We’ll find out in …

2024 Week 07 – Column interaction sorting Read More

2021 Week 1: Can You Find the Variance Along the Line?

Introduction For the longest time, I avoided table calculations as much as I could because I thought they were overly complicated (compute using…relative to…sort by…nested…ughhhh) especially when I had LODs in my back pocket.  But, over time, I’ve made my peace with them (dare I say, a fan now) as I recognized how powerful they …

2021 Week 1: Can You Find the Variance Along the Line? Read More

Scroll to Top