#WOW2022 W43: Advanced Formatting by Jeremy Anderson
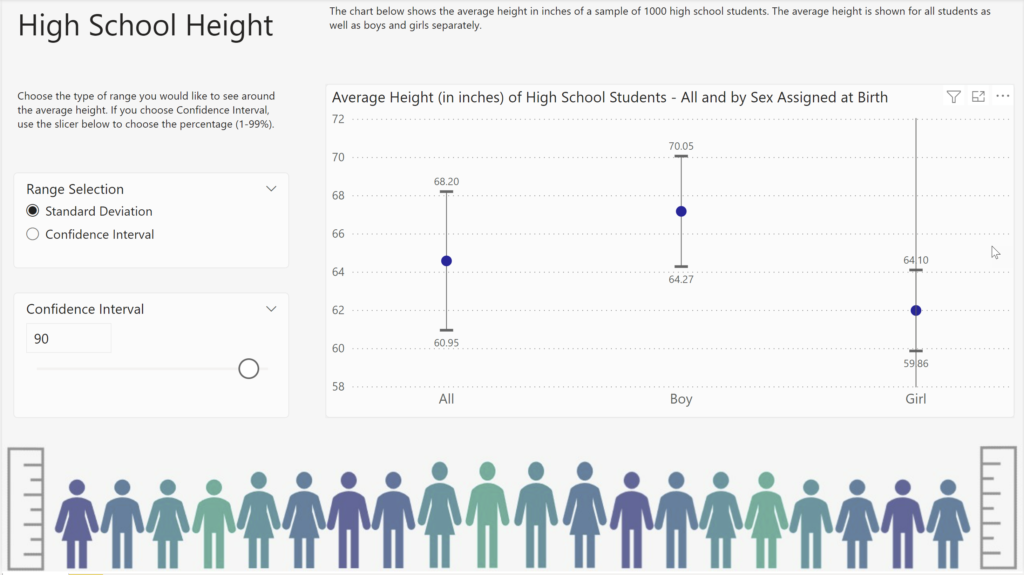
Introduction Conditional formatting is a robust feature in Power BI that you can leverage to help users gain insights. Typically, we see conditional formatting applied to the table and matrix visuals. For example, you might apply a background color, font color, or icons to the values based on a set of rules. Conditional formatting of […]
#WOW2022 W43: Advanced Formatting by Jeremy Anderson Read More »