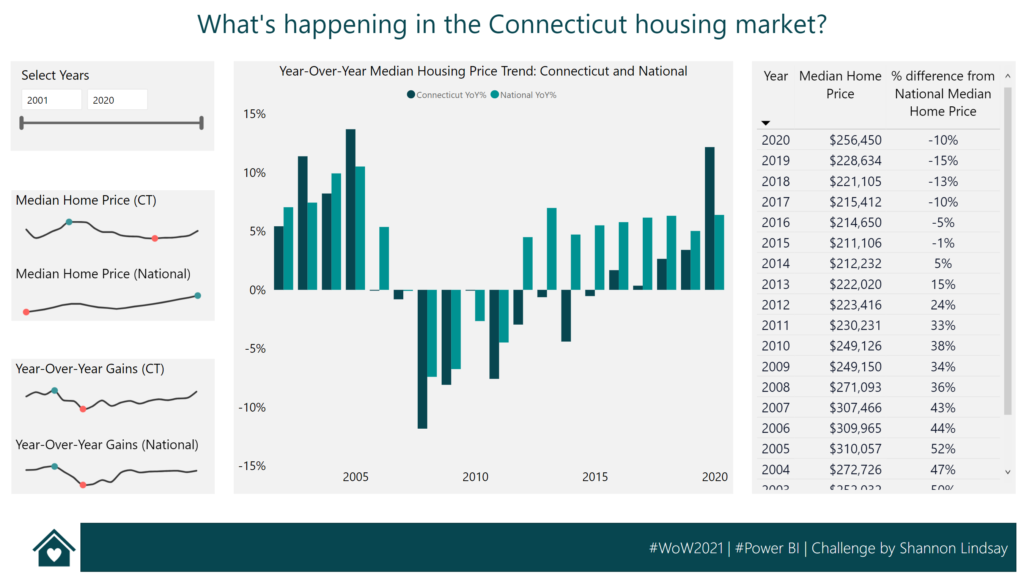
2021 Week 21 | Power BI: Time Intelligence
Introduction The Power BI Workout Wednesday team has decided that May is made for DAX! Each challenge this month will require some DAX in the solution. For this week’s solution we are going to practice DAX time intelligence functions, looking at the housing market in the US state of Connecticut. Time intelligence functions allow you to …
