#WOW2017 | 32 | Continuous Dates are Tricky

Introduction

EDITOR’S NOTE: This challenge was originally published on Emma Whyte’s Tableau blog which no longer exists. This challenge is republished here with the author’s permissions
 

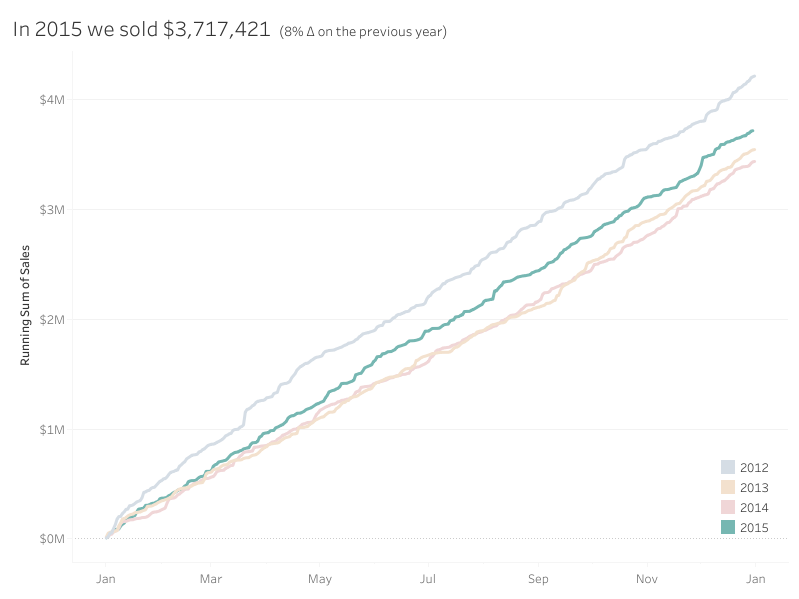
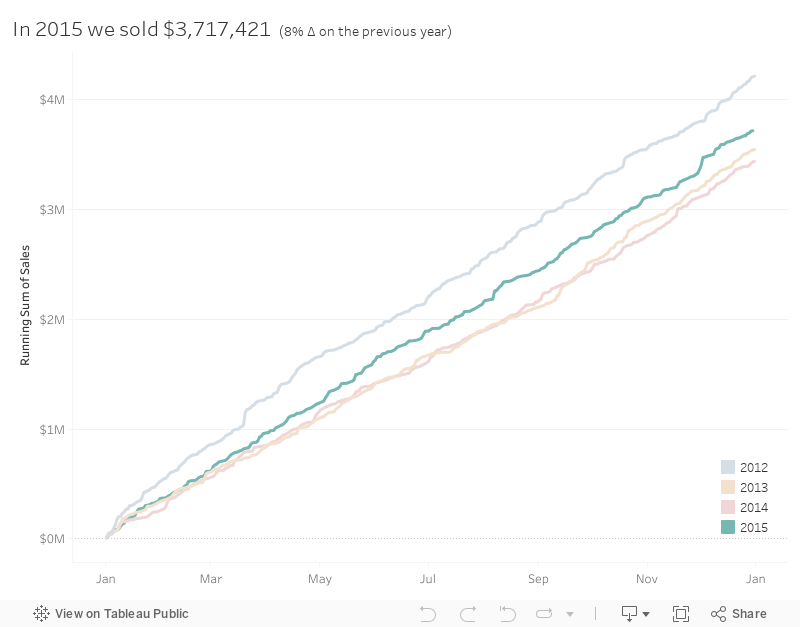
Working with continuous dates can be tricky in Tableau depending on how you want to display them. This weeks #WorkoutWednesday is inspired by a challenge from Data School superstar Neil Lord.

Requirements

For this weeks #WorkoutWednesday challenge you’ll need to:
 
  • Show a running total of sales at a daily level, but split by year of order date
  • Each line for each year should be a different colour. The latest year in the data set should be dark, but the previous years should be transparent. (Note that there is a way to do this without creating a custom palette in Tableau)
  • Make sure your title matches mine. (If I were to add sales data for 2016 my title would also auto update)
  • Make sure your tooltips match
  • Make sure all your axis labels match too

Dataset

Use the most recent version of Superstore or download the data

Attribute

When you publish your solution on Tableau Public make sure to take the time and include a link to the original inspiration.  Also include the hashtag #WOW2023 in your description to make it searchable!

Share

After you finish your workout, share on Twitter and/or LinkedIn using the hashtag #WOW2023 @Tableau and tag @WorkoutWednsday @EmmaWhyte & @vizwizbi


Solution

Interactive

Scroll to Top