Year: 2023

A strip plot

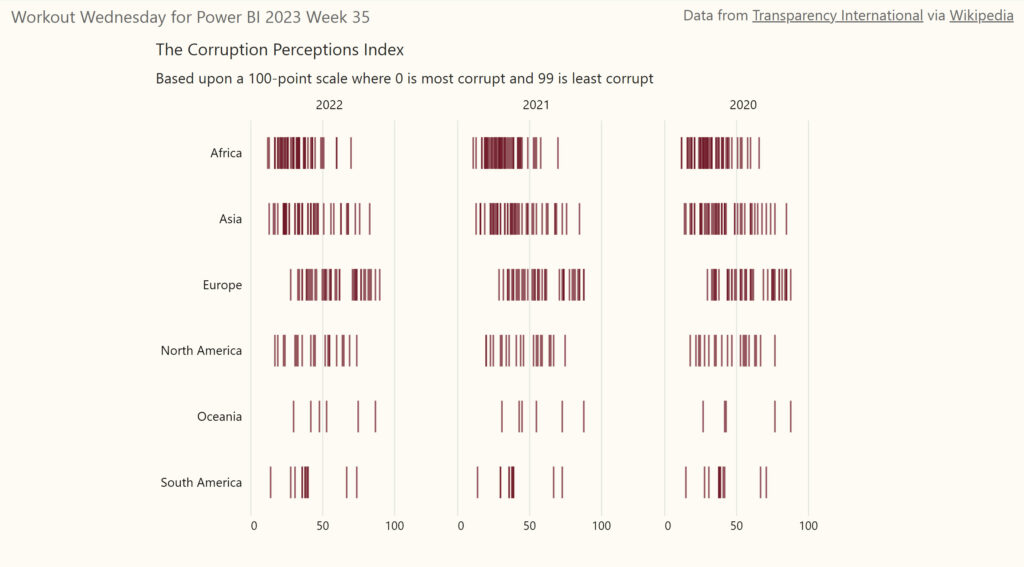
2023 Week 35 | Power BI: Create a Faceted Instance Chart

Introduction Sometimes it can be useful to show all data points instead of aggregating them. That is where an instance chart, also called a strip plot or a barcode plot, can be useful. A strip plot is like a single-axis scatter plot. The symbol or shape used in the instance chart can vary, but it’s …

2023 Week 35 | Power BI: Create a Faceted Instance Chart Read More

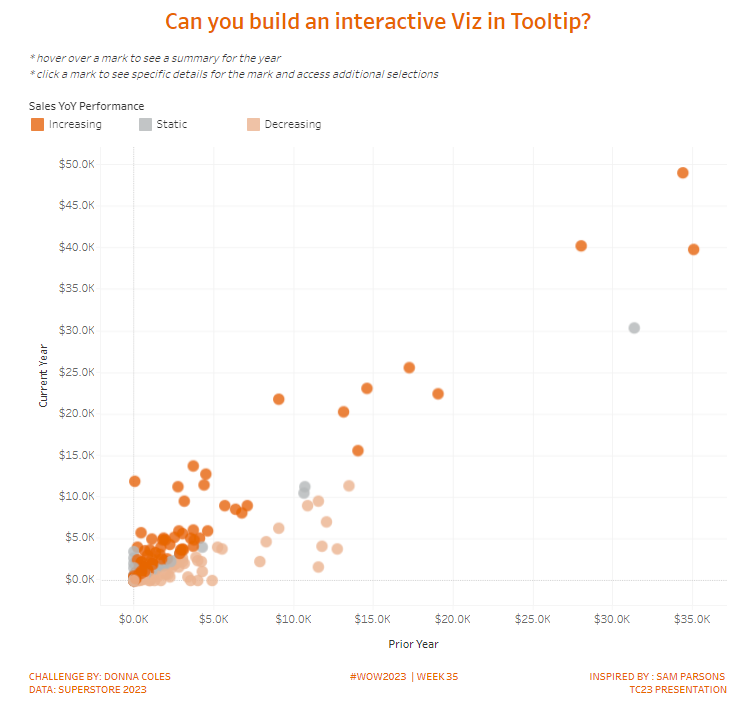
#WOW2023 | Week 35 | Can you build an interactive Viz in Tooltip?

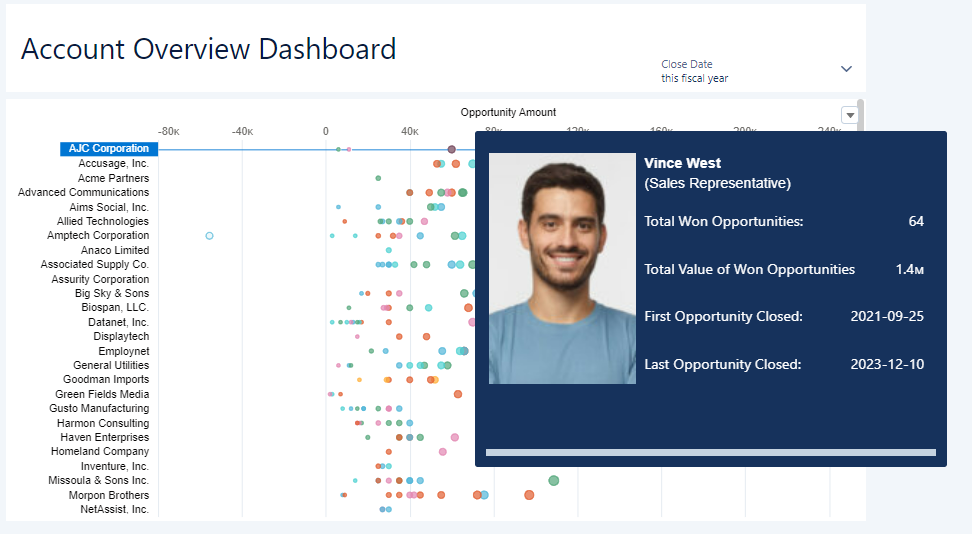
Introduction I’m always on the lookout for ideas for challenges. Typically I’ll see something someone has done and want to know how they did it and whether I can craft it into a WOW challenge. When my colleague, Sam Parsons, demonstrated the concept of an interactive Viz In Tooltip (VIT) at Tableau Conference this year, …

#WOW2023 | Week 35 | Can you build an interactive Viz in Tooltip? Read More

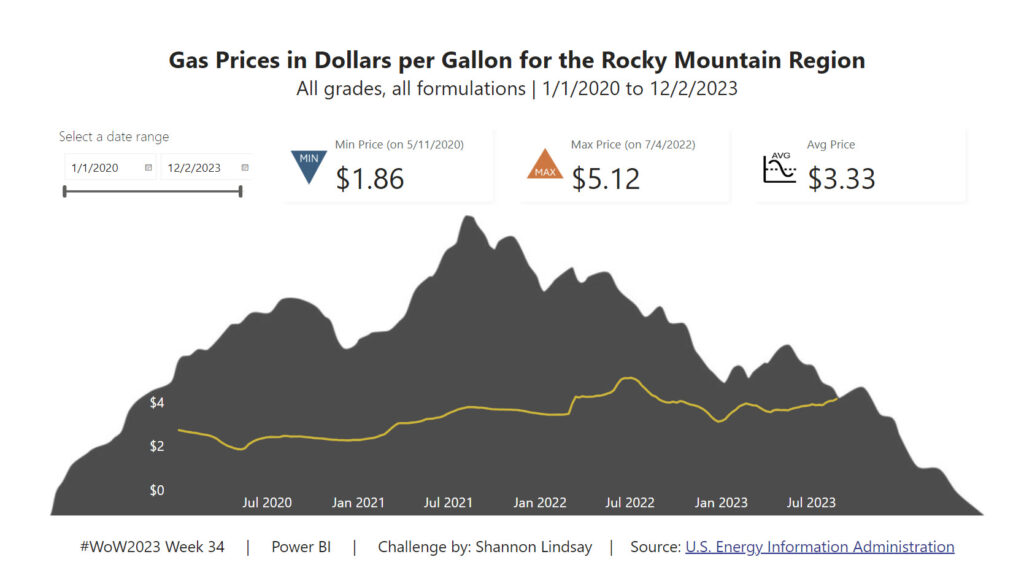
2023 Week 34 | Power BI: Use core visuals with dynamic titles

Introduction Welcome back to Workout Wednesday! This week we’re building some basic visuals and use dynamic titles to visualize gas prices in the Rocky Mountain Region of the US (where I live!) over the past 3 years from the U.S. Energy Information Administration. Be sure you’re using the June 2023 version of Power BI desktop or later …

2023 Week 34 | Power BI: Use core visuals with dynamic titles Read More

Style Guide App

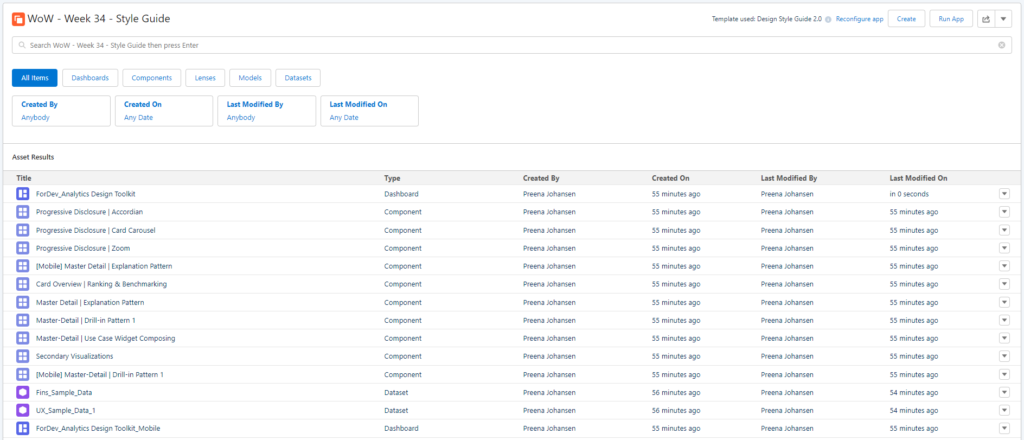
2023 Week 34 | User Experience, Design & Templates

Introduction This week we are exploring user experience and design for CRM Analytics dashboards. Design foundations are the key visual elements to create a consistent interface. This includes guidance on color, type scale and fundamental navigation patterns. Using the Design Style Guide template app gives you a starting point for consistent and best practice design …

2023 Week 34 | User Experience, Design & Templates Read More

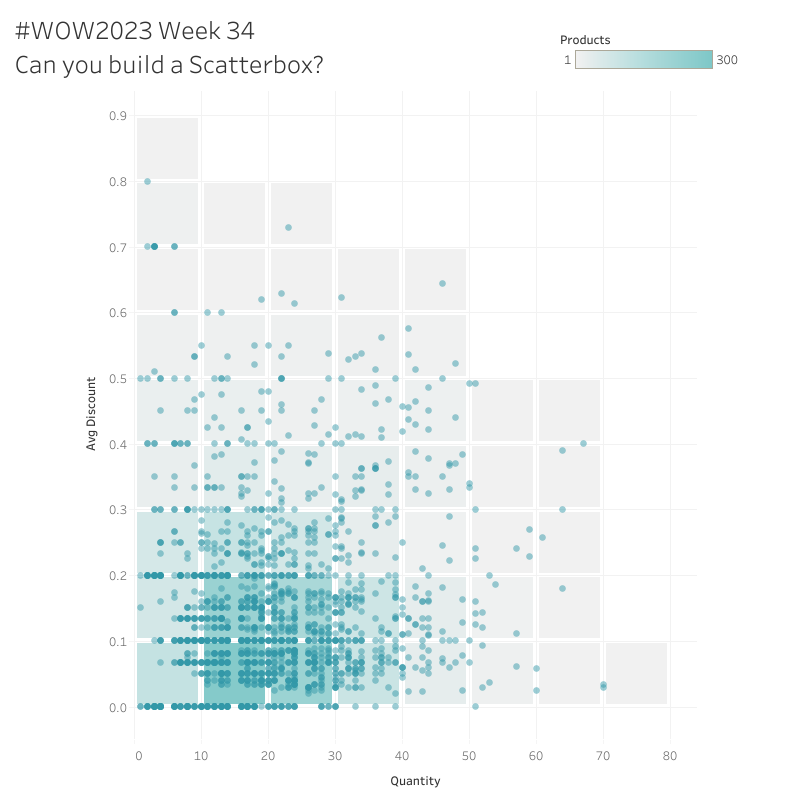
#WOW2023 Week 34: Can you build a scatterbox?

Introduction I’m so excited to invite Felicia Styer to the blog for this week’s challenge! Felicia is the Associate Director of Analytic Solutions at Playfair Data and hales from Kansas City, MO. Connect with her on Twitter and LinkedIn and here is her challenge! Long time fan, first time contributor! This week’s challenge is question …

#WOW2023 Week 34: Can you build a scatterbox? Read More

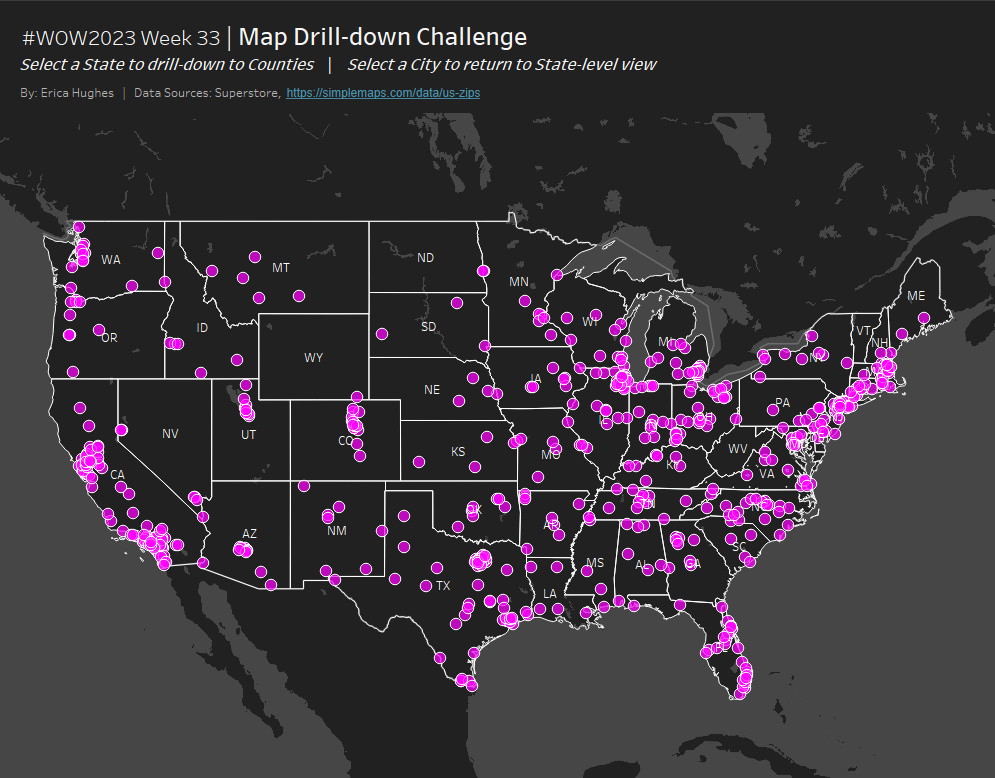
#WOW2023 | Week 33 | Map Drill-down Challenge

Introduction This week I have a full-on Tableau Spatial challenge for you. Just one worksheet. Minimal formatting. It’s all about the behind-the-scenes magic. Enjoy! Click to open in Tableau Public Requirements Dashboard Size: 1000 x 800px 1 sheet Create a map of the 48 ‘contigous’ (aka: mainland) US States Plot points for every City in …

#WOW2023 | Week 33 | Map Drill-down Challenge Read More

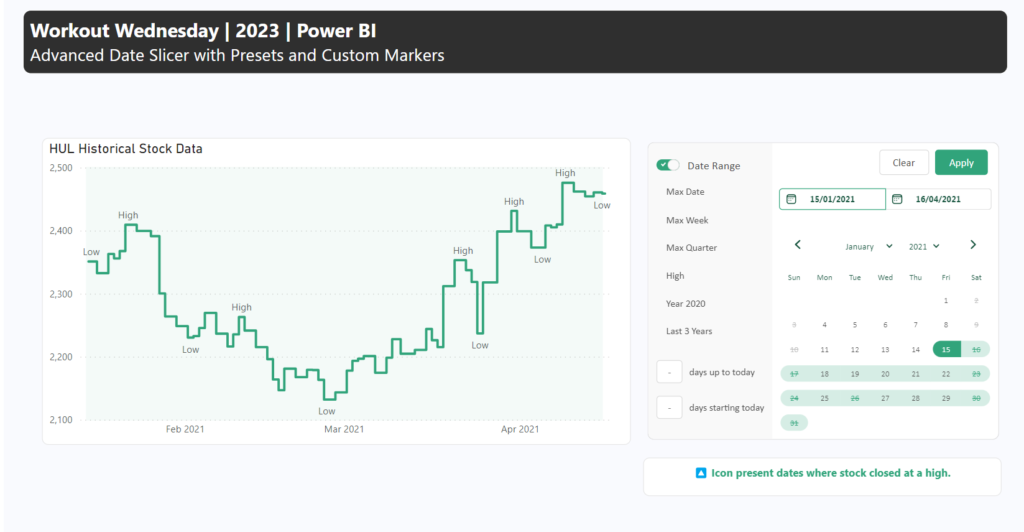
2023 Week 33 | Power BI: Date Slicer

Introduction Welcome to the Workout Wednesday Week 32! This week’s challenge will focus on how to create an advanced date slicer in the Power BI report. A user-friendly and modern-looking slicer to level up your dashboards. You can create your own designs, share them with colleagues and control the preview.   To re-create, I am …

2023 Week 33 | Power BI: Date Slicer Read More

SVG Pictrogram

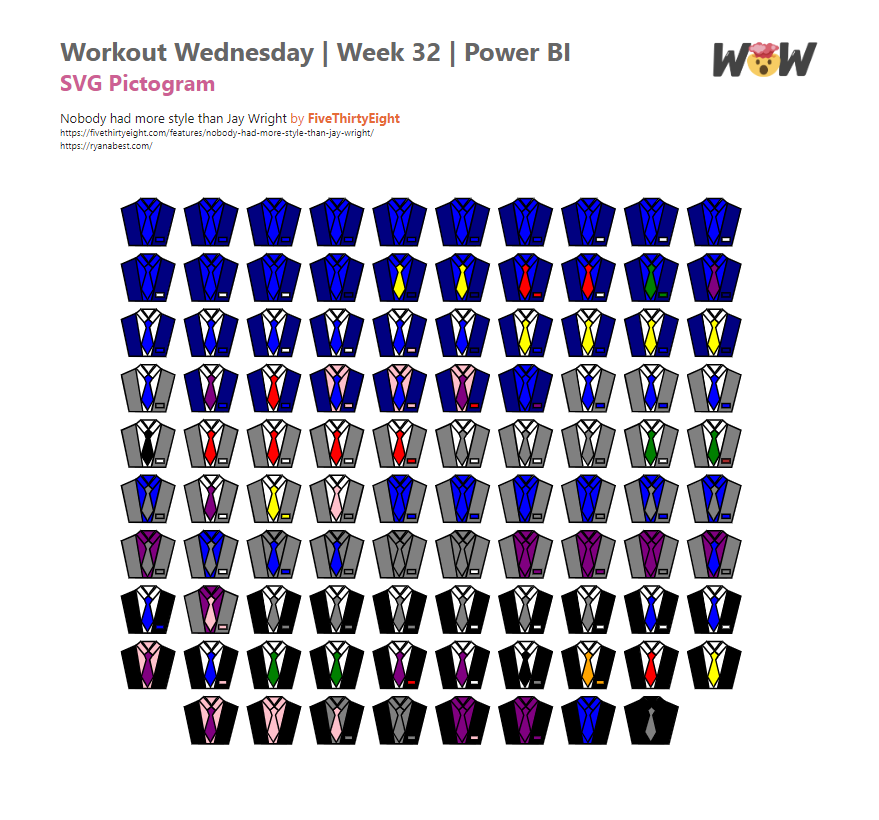
2023 Week 32 | Power BI: SVG Pictogram

Introduction This week’s challenge was inspired by FiveThirtyEight’s Nobody had more style than Jay Wright created by Ryan Best For this week’s challenge we will be creating SVGs with shape elements that are coloured dynamically based on field values. Create your own SVG and add your own flair to this design. Requirements Obtain the source data …

2023 Week 32 | Power BI: SVG Pictogram Read More

A shot of a dashboard and bar charts

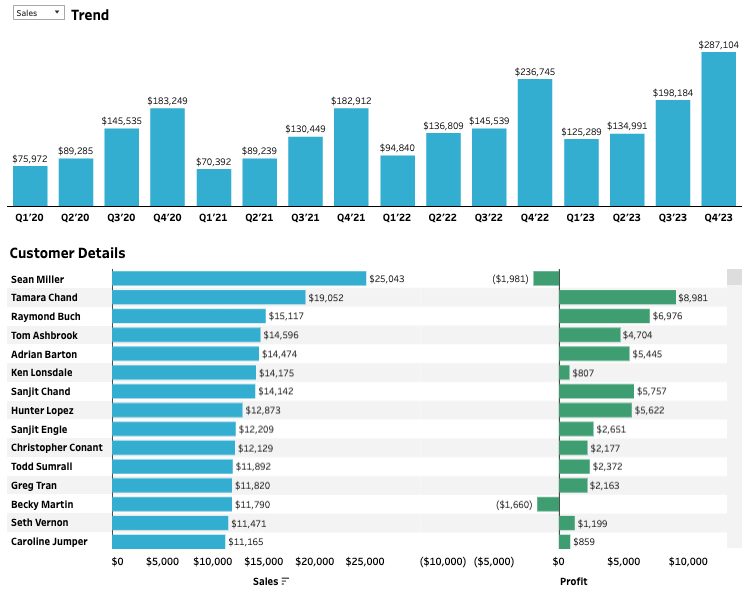
2023 Week 32: Can you show all values when filtering?

Introduction This week we have a special guest, Venkatesh Iyer. Venkatesh is currently a Senior Analytics Consultant at phData–and has recently written a number of blogs that bring novel solutions to the community, including: How to improve the performance of count distinct How to Create a Drill Down Table in Tableau How to paginate in …

2023 Week 32: Can you show all values when filtering? Read More

Scroll to Top