2022 Week 50 | Power BI: Santa Training Game
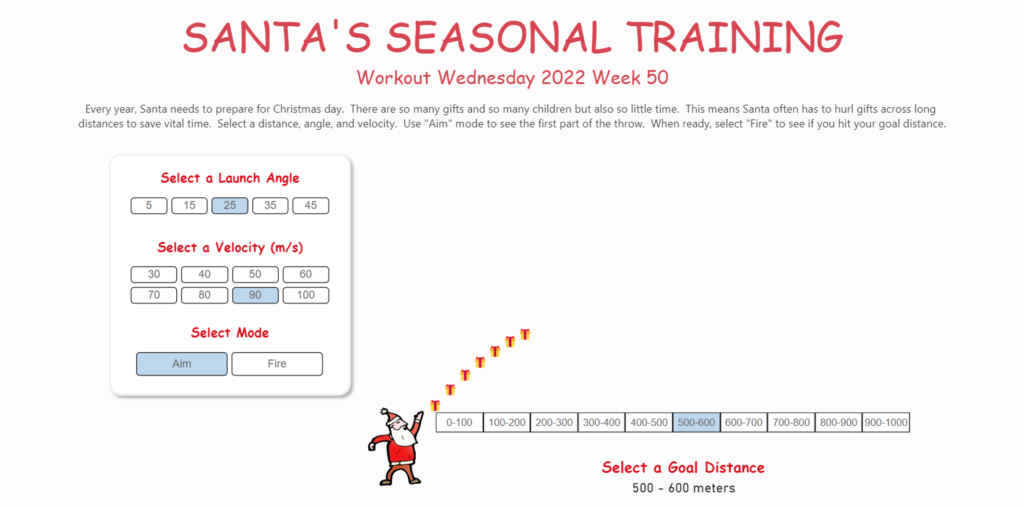
Introduction Every year, Santa needs to prepare for Christmas day. There are so many gifts and so many children but also so little time. This means Santa often has to hurl gifts across long distances to save vital time. For this week’s challenge, we are creating a training game for Santa where he can set …