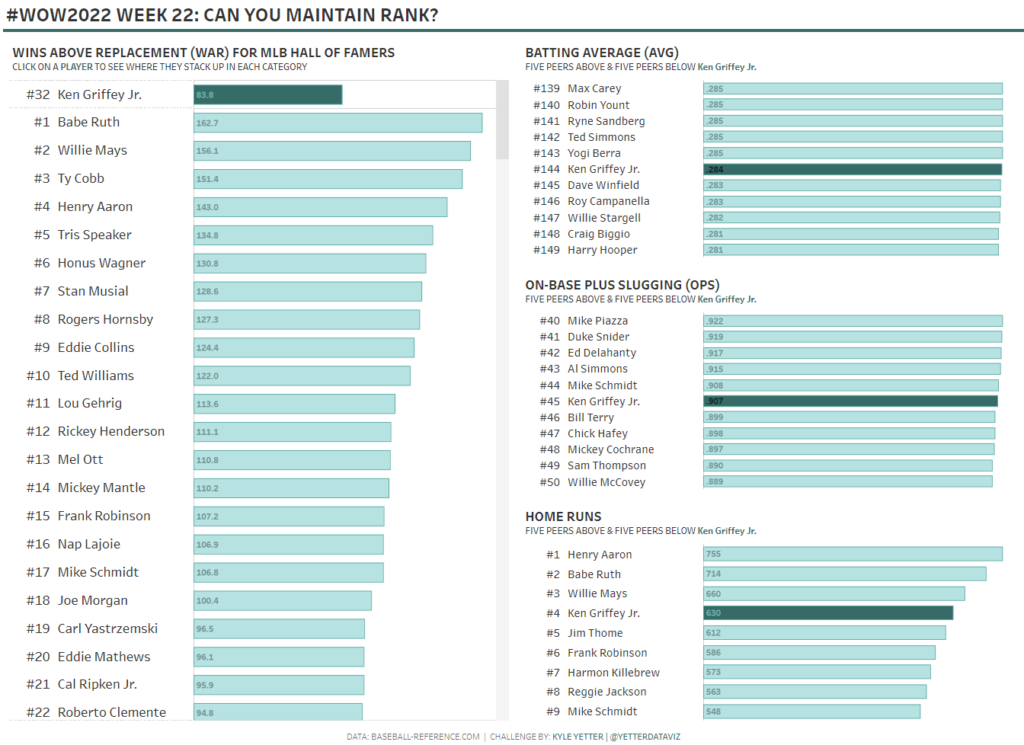
Month: May 2022

#WOW2022 | 21 | Let’s Build a Trellis Chart!

Introduction Fresh off the heels of #Data22, it’s already time for a new #WOW2022 Tableau challenge! One of my favorite charts is the small multiple. It can be used to show a lot of data in a compact view. Typically, small multiples are used to visualize a single measure with two discrete dimensions. And that’s …

#WOW2022 | 21 | Let’s Build a Trellis Chart! Read More

2022 Week 21 | Power BI: Field Parameters

Introduction May is Tableau Redo month, so if you haven’t checked out last week’s report by Kerry Kolosko, make sure to check it out here. Most of the challenges this month have been Power BI remakes of previous Tableau Workout Wednesdays, but this week there was a really big release for the newest version of …

2022 Week 21 | Power BI: Field Parameters Read More

2022 Week 20 | Power BI: Pie Matrix Tableau Redo

Introduction May is Tableau Redo month and this week we will be recreating Tableau #WoW2019 Week 45 by Luke Stanke.   Requirements Filter the data up until November 6th, 2021. Create a matrix showing region and last 7 days (up to November 6th, 2021). Create SVG Measures to build a doughnut chart that shows the …

2022 Week 20 | Power BI: Pie Matrix Tableau Redo Read More

2022 – Week 19: Can you format the dashboard?

Introduction This week the challenge focuses on formatting and your ability to use containers. The goal is to create a near pixel perfect copy of the original. Focus on your use of containers along the way. Click to open in Tableau Public Requirements Dashboard Size: 1100px by 850 px 9 sheets About 7 vertical containers …

2022 – Week 19: Can you format the dashboard? Read More

2022 Week 19 | Power BI: Oh Rats! Tableau Recreation

Introduction A few week’s ago, Sean Miller created an incredibly slick dashboard showing Rat Sightings in New York since 2010 for week 16 of Tableau’s Workout Wednesday (Challenge Link).  The challenge used Hexbins to combine multiple map points into shapes of the same size to show density more clearly within a map.  This week, we’re …

2022 Week 19 | Power BI: Oh Rats! Tableau Recreation Read More

Screenshot from Power BI Workout Wednesday 2022 Week 18

2022 Week 18 | Power BI: Remake this Tableau budget burndown chart

Introduction For the month of May, we are remaking Tableau visualizations with Power BI. Although the visuals made by the two tools may be similar, the calculations and formatting options are a bit different. This makes some things easier in one tool compared to the other. If you use both Power BI and Tableau, feel …

2022 Week 18 | Power BI: Remake this Tableau budget burndown chart Read More

Scroll to Top