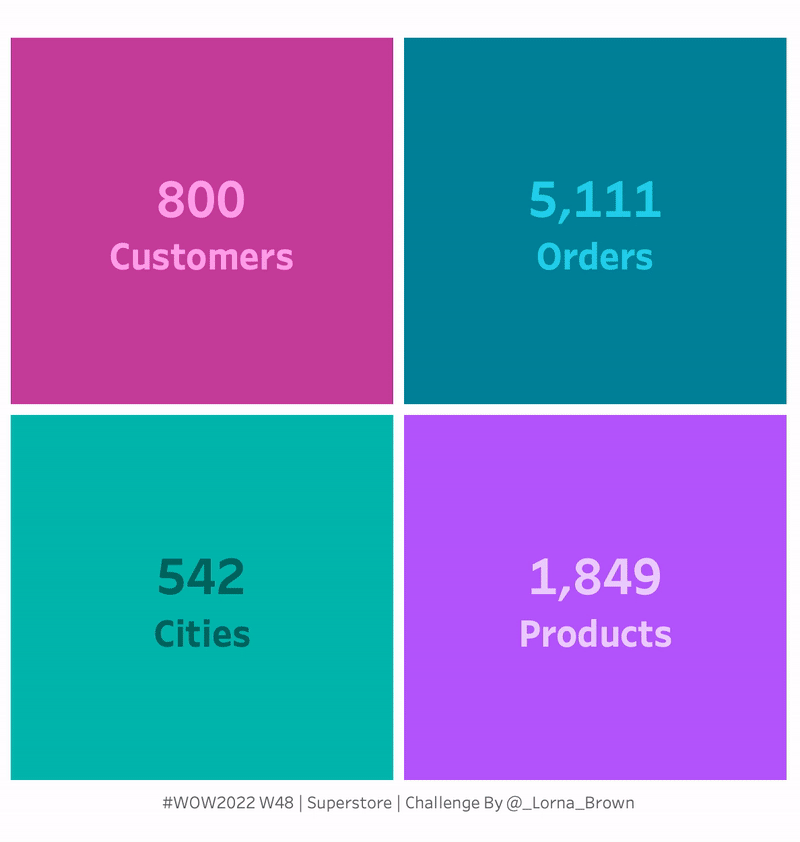
2022 Week 48 | Power BI: Conditional SVG Measures
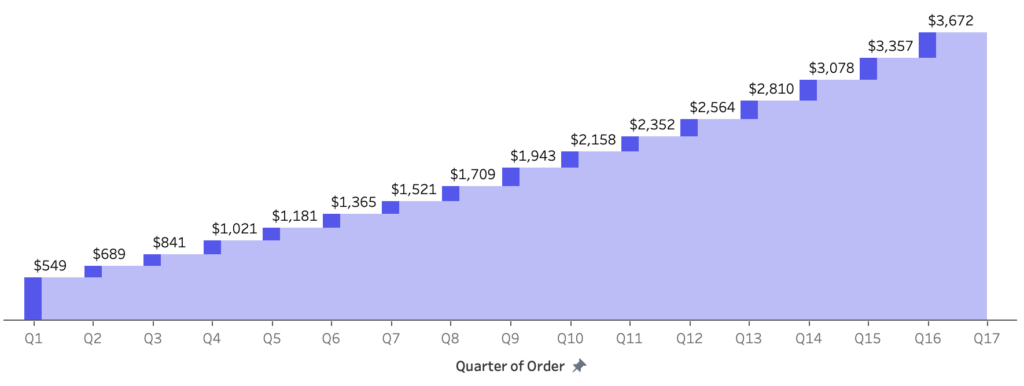
Introduction While we looked at SVG measures in a matrix in week 20, we are taking a different approach this week. SVG measures can be used in other visuals, and they can be designed to include links. In the below Power BI report, I’ve got 4 visuals populated by SVG measures. Initially, all 4 visuals show …