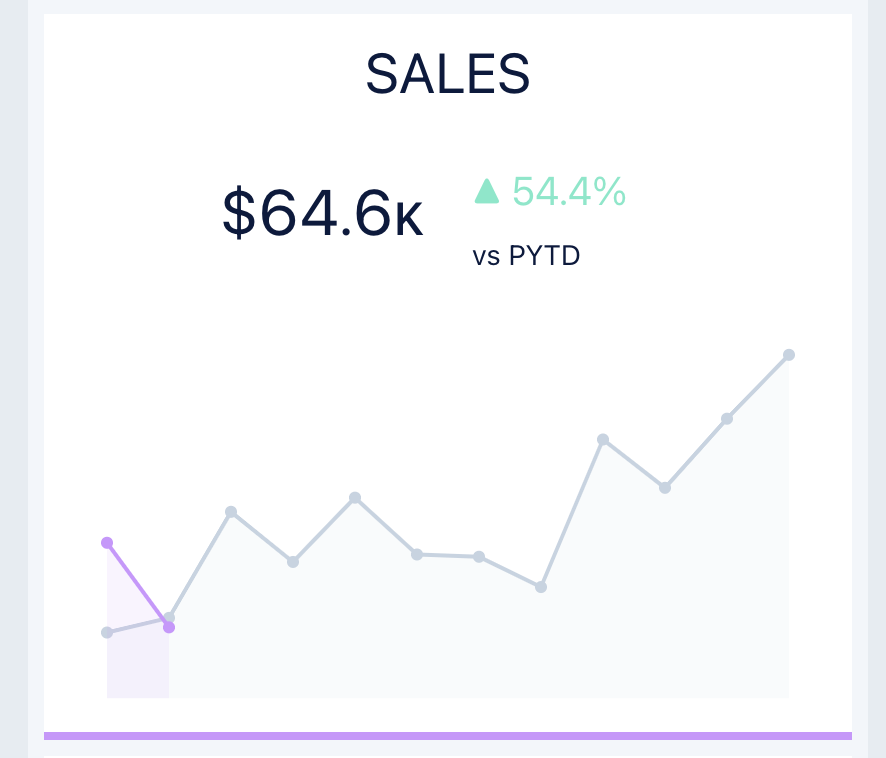
2023 Week 09 | Power BI: Create a table with custom and built-in microcharts
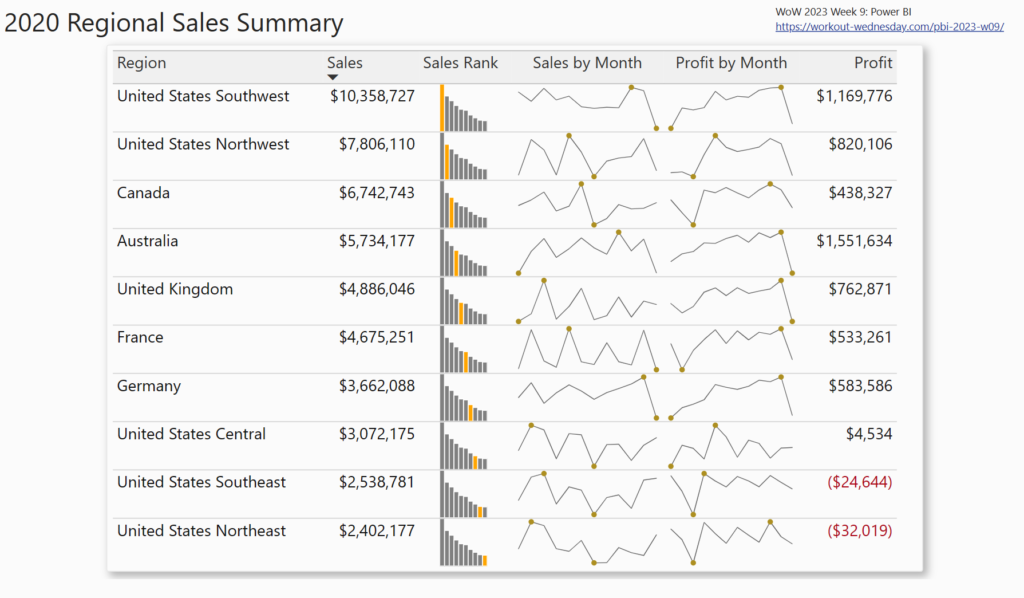
Introduction This week we are making a table with microcharts (sparklines). Power BI does offer built-in sparklines, but sometimes we want formatting options not available with the defaults. Our challenge this week uses both the built-in sparklines and custom SVG images in a table. Requirements Create a custom column with the following logic: If the …
2023 Week 09 | Power BI: Create a table with custom and built-in microcharts Read More