Month: March 2023

2023 Week 13 | Power BI: Create a connected scatterplot with image markers

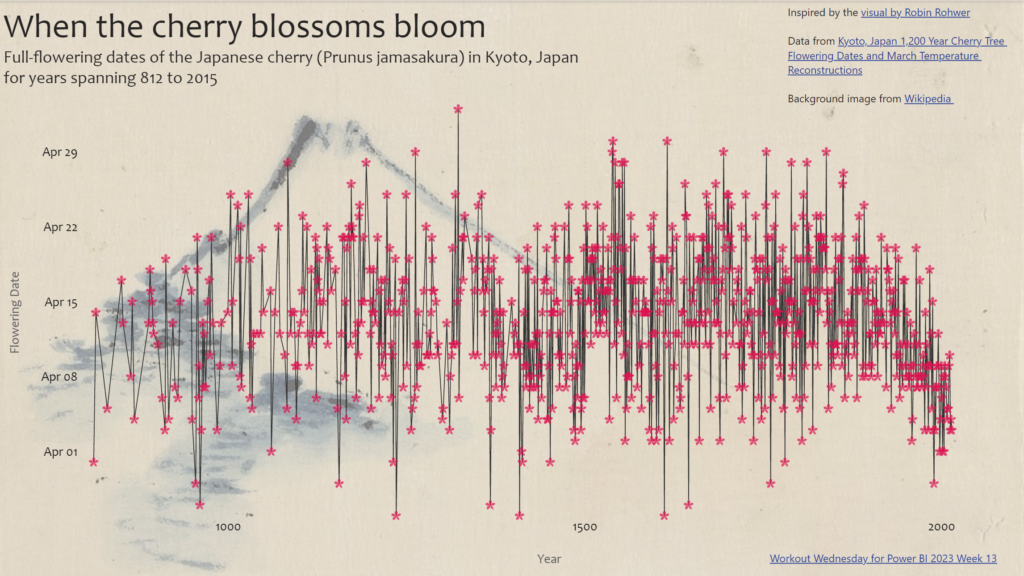
Introduction This week we are getting a bit artistic and taking inspiration from a visual that was recently published by Robin Rohwer on Twitter. She created a connected scatterplot that uses a flower emoji to represent each point. I thought her visual was wonderful, so I set out to create something like it in Power …

2023 Week 13 | Power BI: Create a connected scatterplot with image markers Read More

2023 Week 12 | Data Syncs & Scheduling

Introduction Hello and welcome to WoW week 12! This weeks challenge will be short & sweet from a requirements perspective but will hopefully provide valuable insights to help you optimize your data sync cycle. Tip… check out the Tips section! Requirements Navigate to the dataset created in a previous exercise, or create a new one …

2023 Week 12 | Data Syncs & Scheduling Read More

#WOW2023 | Week 12 | Can you build a dashboard using containers?

Introduction A few weeks ago I saw this Twitter poll (and the ensuing discussion) about Team Tiled vs Team Floating and I noted that I am neither. Rather, I am Team Container. Using Containers in dashboards makes positioning and sizing everything in your dashboard a piece of cake, once you have mastered how they work. …

#WOW2023 | Week 12 | Can you build a dashboard using containers? Read More

Image of Power BI report.

2023 Week 12 | Power BI: Are your reports accessible?

Introduction Welcome back to Workout Wednesday! This week we’re taking a note out of Meagan’s book and looking at existing reports to ensure they’re accessible to our end-users.  Creating accessible Power BI reports isn’t just a nice-to-have feature, but a crucial aspect for ensuring all users can access and understand your data. Don’t let accessibility …

2023 Week 12 | Power BI: Are your reports accessible? Read More

2023 Week 11 | Du Bois Challenge

Introduction This week we align ourselves with the DuBois challenge, which aims at celebrating the work of W.E.B. Du Bois. You can learn more about him, his visualisations, the data behind them and the challenge here: https://github.com/ajstarks/dubois-data-portraits Some of his charts are quite “out there” so I chose one that could be recreated in CRMA. …

2023 Week 11 | Du Bois Challenge Read More

#WOW2023 | Week 11 | Can You Compare State Sales?

Introduction This week’s challenge is focused on interactivity, and was born out of a client requirement to compare store locations via selections from a map. I’ve naturally adapted it to use our favourite Superstore dataset. The core requirement is to be able to make a selection on the map and see how sales compare to …

#WOW2023 | Week 11 | Can You Compare State Sales? Read More

Scroll to Top